You only care about one field. A pricing endpoint returns forty keys, and you need to know when data.plan.price changes. A status feed returns a giant object, and the only thing that matters is components[2].status flipping from operational to degraded. A partner API returns a record, and you want an alert the day deprecated becomes true.
The naive approach is to monitor the entire response body and diff it on every check. That works until the response includes a timestamp, a request_id, a rate_limit_remaining counter, or a last_updated field that ticks on every request. Now every check reports a change, your alerts become noise, and you stop reading them. The one field you actually cared about is buried under data that was never going to stay still.
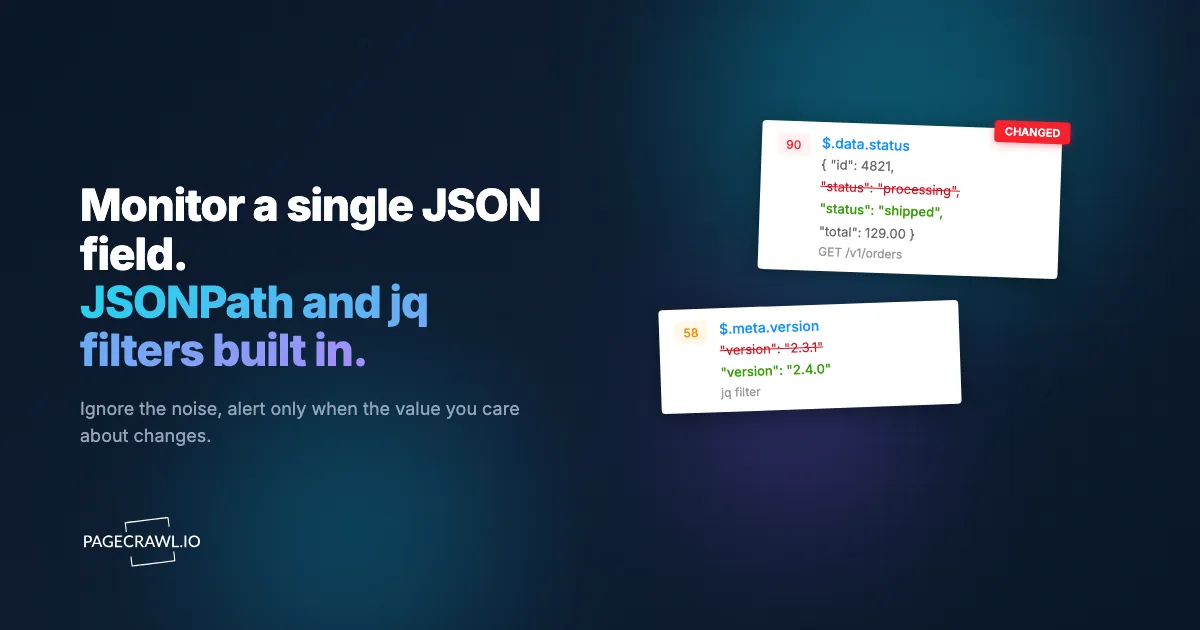
The fix is to extract a single field before you compare anything. JSONPath and jq are the two standard tools for pulling one value out of a JSON blob, and once you isolate that value, change detection becomes trivial: the field either changed or it did not. This guide shows how to write those filters, how to test them against real responses, and how to wire the whole thing into automated monitoring so you get an alert only when the field you chose actually moves. For the wider picture of what to watch across your API surface, start with the complete guide to API monitoring and change alerts.
Why is filtering better than diffing the whole response?
Because a JSON response is rarely stable end to end. Request IDs, timestamps, and rate-limit counters move on every single call, so a whole-body diff alerts constantly and tells you nothing. Extracting one field first means the comparison can only fire when that field actually changes.
{
  "request_id": "req_8f3a21c9",
  "generated_at": "2026-07-08T14:22:09Z",
  "plan": {
    "name": "Standard",
    "price": 8.00,
    "currency": "USD"
  },
  "rate_limit": {
    "remaining": 4871
  }
}
If you diff this whole object, request_id, generated_at, and rate_limit.remaining all change on every single request. You will get a "change detected" alert every check, forever, and none of them mean anything. The actual signal you want, plan.price, is one number among the noise.
Filtering to plan.price before comparison solves this completely. The extracted value is 8.00 today and 8.00 tomorrow, so no alert fires. The day it becomes 10.00, the extracted value changes and you get exactly one notification. No false positives from timestamps, no manual diff reading, no alert fatigue.
This is the core idea: isolate the field, then compare. JSONPath and jq are the two ways to do the isolation.
JSONPath or jq: which should you use?
Use JSONPath to point at a value inside a predictable structure, which covers most monitoring cases, and jq when you need to compute or reshape something first. Both solve the same problem from different ecosystems: JSONPath is a query syntax (loosely modeled on XPath) standardised as RFC 9535 with implementations in nearly every language, while jq is a standalone command-line processor and a small functional language for transforming JSON.
| Aspect | JSONPath | jq |
|---|---|---|
| Form | Query string | Command-line tool and language |
| Typical use | Embedded in apps, monitoring tools, libraries | Shell scripts, CI, ad-hoc terminal work |
Syntax for plan.price |
$.plan.price |
.plan.price |
| Arrays | $.items[0], $.items[*].id |
.items[0], .items[].id |
| Filtering by condition | $.items[?(@.active==true)] |
.items[] | select(.active==true) |
| Transform / compute | Limited | Full (math, string ops, joins) |
| Availability | Library in most languages | Single binary, install via package manager |
| Best for | Pulling a value out of a known shape | Pulling and reshaping, or scripting in a pipeline |
The short version: reach for JSONPath when you just need to point at a value inside a predictable structure, which is most monitoring cases. Reach for jq when you are working in a terminal or CI pipeline, or when you need to compute something (round a number, join an array into a string, count matching items) before comparing. Many monitoring setups use JSONPath because it embeds cleanly into a tool's configuration, and fall back to jq for the cases that need real transformation.
Writing JSONPath Filters
JSONPath expressions start at the root $ and walk down into the structure with dot or bracket notation. Here are the patterns you will use most, against this sample response:
{
  "status": "ok",
  "service": {
    "version": "2.4.1",
    "deprecated": false
  },
  "endpoints": [
    { "path": "/v2/users", "status": "stable" },
    { "path": "/v2/orders", "status": "beta" },
    { "path": "/v1/legacy", "status": "deprecated" }
  ]
}
Single field, top level
$.statusReturns "ok". The simplest case, and the most common: one named field you want to watch.
Nested field
$.service.versionReturns "2.4.1". Walk down through each key with a dot. The moment a vendor bumps the version, your extracted value changes from 2.4.1 to 2.5.0 and an alert fires.
Array element by index
$.endpoints[0].statusReturns "stable". Use this when the array order is stable and you care about a fixed position.
Filter an array by condition
$.endpoints[?(@.path=="/v2/orders")].statusReturns "beta". This is the resilient pattern. Instead of trusting that /v2/orders is always at index 1, you select the element by its path and read its status. If the vendor reorders the array, your filter still finds the right element. The day /v2/orders goes from beta to stable, you get an alert.
Boolean flag
$.service.deprecatedReturns false. Booleans are perfect monitoring targets because they only flip. An alert here means the value went from false to true, which is almost always something you need to act on.
Count matching elements
Some JSONPath implementations support length() or aggregate functions; many do not. If you need a count (for example, "alert me when the number of deprecated endpoints changes"), this is usually a cleaner job for jq.
Writing jq Filters
jq uses leading-dot paths and pipes filters together with |. Run it against a file or pipe a response straight in. Using the same sample response as above:
Single field
curl -s https://api.example.com/status | jq '.status'Outputs "ok". The -s on curl keeps the progress meter out of your output, which matters when you are piping.
Nested field, raw output
curl -s https://api.example.com/status | jq -r '.service.version'Outputs 2.4.1 without surrounding quotes. The -r (raw) flag is what you want when you are going to compare or store the value, because "2.4.1" and 2.4.1 are different strings to a diff tool.
Select an array element by condition
jq -r '.endpoints[] | select(.path=="/v2/orders") | .status' response.jsonOutputs beta. This is the jq equivalent of the resilient JSONPath filter: find the element by a stable key, then read the field you care about, regardless of array order.
Compute and reshape before comparing
This is where jq earns its place. Suppose you want to monitor "how many endpoints are deprecated" rather than the raw list:
jq '[.endpoints[] | select(.status=="deprecated")] | length' response.jsonOutputs 1. Now your monitored value is a single integer. It stays 1 until a vendor deprecates another endpoint, at which point it becomes 2 and you get exactly one alert. You have turned a noisy array into a clean scalar signal.
You can also normalize values that would otherwise cause false positives. If a price field sometimes returns 8 and sometimes 8.00, round it to a fixed form before comparing:
jq -r '.plan.price | . * 100 | round / 100' response.jsonBuild a stable composite
If you want to watch several fields together and alert when any of them change, concatenate them into one string:
jq -r '"\(.service.version)|\(.service.deprecated)|\(.status)"' response.jsonOutputs 2.4.1|false|ok. One value, three fields watched. This keeps you to a single monitor instead of three.
Testing Your Filter Before You Trust It
Never wire up a filter you have not run against the real response. Vendors lie in their docs, fields are nested deeper than expected, and arrays are not always arrays.
Test jq locally
Save a live response and iterate:
curl -s https://api.example.com/status > sample.json
jq -r '.service.version' sample.json
If jq returns null, your path is wrong. Print the keys at each level to find the real structure:
jq 'keys' sample.json
jq '.service | keys' sample.json
Test JSONPath
Most languages have a JSONPath library you can test in a REPL. In Python with jsonpath-ng:
from jsonpath_ng import parse

import json
data = json.load(open("sample.json"))
expr = parse("$.endpoints[?(@.path=='/v2/orders')].status")
print([m.value for m in expr.find(data)])
There are also browser-based JSONPath and jq playgrounds where you paste a response and try expressions interactively. Use one before committing a filter to a monitor.
Watch for these gotchas
nullvs missing. A field that is present butnulland a field that is absent both extract to nothing, but they mean different things. If a field disappearing is itself the signal you want, test that case explicitly.- Number formatting.
8and8.00are the same number but different text. Normalize with jq math, or accept that a format change will fire one alert. - Single result vs array. JSONPath filter expressions return a list even when one element matches. Pull
[0]if a downstream tool expects a scalar. - Whitespace and key order. If you ever fall back to comparing a JSON sub-object instead of a scalar, key reordering by the server will look like a change. Prefer extracting a single value.
Automating the Monitoring
Running a filter once tells you the value now. Monitoring means running it on a schedule and alerting only when the extracted value changes from the last run. You have two practical routes.

Route 1: Build it yourself
A small script on a cron schedule does the job. Fetch, filter, compare to the stored value, alert on difference.
import json
import subprocess
import requests

STATE_FILE = "last_value.txt"
API_URL = "https://api.example.com/status"

def extract(data):
    # the field you care about
    for ep in data.get("endpoints", []):
        if ep.get("path") == "/v2/orders":
            return ep.get("status")
    return None

def load_last():
    try:
        return open(STATE_FILE).read().strip()
    except FileNotFoundError:
        return None

def main():
    resp = requests.get(API_URL, headers={"Authorization": "Bearer YOUR_TOKEN"})
    current = str(extract(resp.json()))
    last = load_last()
    if last is not None and current != last:
        notify(f"/v2/orders status changed: {last} -> {current}")
    open(STATE_FILE, "w").write(current)

def notify(message):
    # post to Slack, send email, hit a webhook
    requests.post("https://hooks.slack.com/services/XXX", json={"text": message})

if __name__ == "__main__":
    main()
The jq equivalent as a shell cron job is even shorter:
#!/usr/bin/env bash
URL="https://api.example.com/status"
NEW=$(curl -s -H "Authorization: Bearer $TOKEN" "$URL" \
  | jq -r '.endpoints[] | select(.path=="/v2/orders") | .status')
OLD=$(cat last_value.txt 2>/dev/null)
if [ -n "$OLD" ] && [ "$NEW" != "$OLD" ]; then
  curl -s -X POST "$SLACK_WEBHOOK" \
    -d "{\"text\":\"/v2/orders status changed: $OLD -> $NEW\"}"
fi
echo "$NEW" > last_value.txt
This is fine for one or two fields. The cost shows up when you have twenty of them: you are now maintaining cron entries, state files, secrets, notification code, and retry logic across a fleet of tiny scripts. You also have no history, no UI, and no way for a teammate to see what is being watched.
Route 2: Use a monitoring tool with a JSON filter
A hosted monitor handles the schedule, the state, the diff, and the notifications for you. With PageCrawl, the flow is the same as the script but without the plumbing.
Step 1: Create a monitor for the API endpoint. Add the full URL, for example https://api.example.com/status. If the endpoint needs authentication, set the request headers (Bearer token, API key) directly on the monitor.
Step 2: Apply a JSON field filter. Instead of tracking the whole response, point the monitor at the single field with a JSONPath expression like $.endpoints[?(@.path=="/v2/orders")].status. The monitor extracts that value on every check and compares only that, so volatile fields like request_id and generated_at are ignored. The JSON path filter is one of the tracked element types PageCrawl offers, alongside number, text, and file tracking.
Step 3: Set the check frequency. Match it to how fast the field can realistically change and to the API's rate limits. A status field might warrant every few minutes; a deprecation flag is fine daily.
Step 4: Configure notifications. Send the alert to Slack, email, or a webhook. When a check finds the extracted field has changed, you get one notification with the old and new values, not a wall of diff. The webhook payload reference shows the exact JSON your endpoint receives.
Step 5: Let the history accumulate. Every check is stored, so you can see exactly when beta became stable weeks later, without having kept your own logs.
The advantage over the homegrown script is not the extraction itself, which is the same JSONPath you already wrote. It is that the schedule, retries, authentication storage, change history, and multi-channel alerting are handled, and a teammate can see and edit the monitor without reading your cron tab.
Which JSON fields are worth monitoring?
Five field types cover the API failure modes that actually hurt: deprecation flags, version strings, status and health fields, pricing or plan values, and feature flags or quotas. Each one is a scalar, which makes it a clean signal rather than a noisy diff.
- Deprecation flags.
$.service.deprecatedor asunsetdate field. The day it flips, you have lead time to migrate instead of discovering it from a 410, which is why field filtering pairs so well with API and documentation change monitoring on the vendor's docs site. - Version strings.
$.service.versionor aversionheader surfaced in the body. A bumped version is your cue to read the changelog. Pair this with monitoring the API's documentation and changelog pages. - Status and health fields.
$.statusor a per-component status inside an array. Catches degradation before your error rate does. - Pricing and plan fields. A single price or limit value, the API-side counterpart to price and availability monitoring on a product page. Useful for watching the vendor APIs you resell or depend on commercially, or fast-moving numeric feeds like sportsbook odds and line movement that you want to catch on the first check after a value crosses your threshold.
- Feature flags and quotas. A
max_requestsorfeature_enabledfield changing tells you the contract shifted even when no endpoint structure did.
For structural changes (fields added or removed, types changing) rather than single-value changes, the broader techniques in monitoring REST APIs for breaking changes apply. Field filtering and structure monitoring complement each other: filtering catches the specific value you depend on, structure monitoring catches the shape moving underneath you.
Connecting Alerts to Action
A change alert is most useful when it kicks off the next step automatically. A webhook payload carrying the old and new values can open a ticket, post to a channel, or trigger a deploy gate.
If you route alerts through n8n or Zapier, the changed field value becomes the input to a workflow: a price change updates a spreadsheet, a deprecation flag opens a Jira issue, a status flip pages on-call. And if you run AI agents, the same change events can feed them through webhooks so an agent decides what to do with the new value rather than a human triaging the alert.
Choosing your PageCrawl plan
PageCrawl's Free plan lets you monitor 6 pages with 220 checks per month, which is enough to validate the approach on your most critical pages. Most teams graduate to a paid plan once they see the value.
| Plan | Price | Pages | Checks / month | Frequency |
|---|---|---|---|---|
| Free | $0 | 6 | 220 | every 60 min |
| Standard | $8/mo or $80/yr | 100 | 15,000 | every 15 min |
| Enterprise | $30/mo or $300/yr | 500 | 100,000 | every 5 min |
| Ultimate | $99/mo or $999/yr | 1,000 | 100,000 | every 2 min |
Annual billing saves two months across every paid tier. Enterprise and Ultimate scale up to 100x if you need thousands of pages or multi-team access.
At an engineering hourly rate, Standard at $80/year pays for itself the first time you catch a breaking API change, a deprecated endpoint, or a silent config change before it takes down production. 100 monitored pages is enough to cover the changelogs and docs of every third-party API your stack depends on. Enterprise at $300/year adds 5-minute checks and 500 pages. All plans include the PageCrawl MCP Server, which plugs directly into Claude, Cursor, and other MCP-compatible tools. Developers can ask "what changed in the Stripe API docs this month?" and get a summary pulled from your own monitoring history. AI assistants can create monitors through conversation on every plan, including Free, turning your tracked pages into a living knowledge base instead of a pile of alert emails.
Getting Started
Pick the single most painful field you currently find out about too late. The deprecation flag on a partner API, the version string on a dependency, the price on a vendor plan you resell.
- Grab a live response with
curl -s URL > sample.json. - Write a filter for that one field and confirm it against the sample with
jq -r 'YOUR.PATH' sample.jsonor a JSONPath playground. - Create a monitor for the endpoint, paste in the filter, add any auth headers, and point alerts at Slack or email.
Run it for a week and watch how quiet it is: no noise from timestamps or counters, just one notification the day the value you chose actually moves. Once you trust it, add the next field, and the next. PageCrawl's free tier covers 6 monitors with custom JSON field filters and multiple notification channels, which is enough to wrap the handful of API fields your product genuinely cannot afford to miss.