You can track numeric values on a page using the "Number" tracked element type. This extracts numbers from a selected area on the page and displays them in a chart so you can quickly see the history of values and spot trends. Instead of manually checking a number every day, PageCrawl monitors it for you and builds a visual record over time.
What You Can Track
Common things to monitor with the Number tracker:
- E-commerce: Product prices, discounts, stock quantities available
- Finance: Stock prices, cryptocurrency values, exchange rates
- Analytics: Page views, visitor counts, conversion rates
- Ratings: Product ratings, review scores, customer satisfaction metrics
- Inventory: Stock levels, warehouse quantities, supply counts
Set Up on PageCrawl.io
- Log in to your pagecrawl.io account
- Click Track New Page and enter the URL of the page containing the number you want to monitor
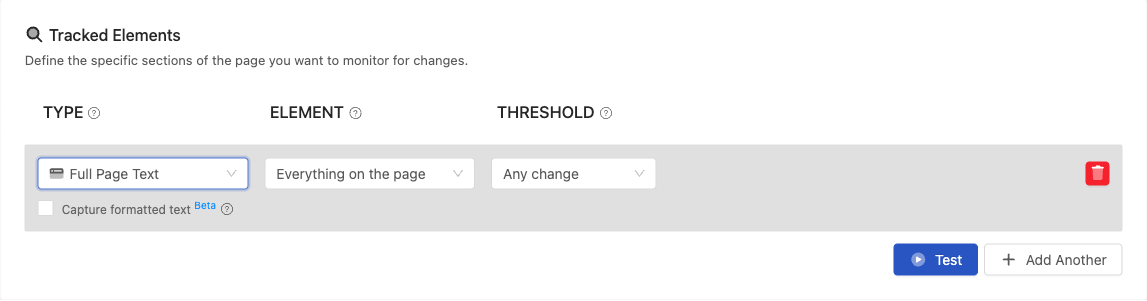
- Click Tracked Elements to add what you want to monitor
- Select "Number" as the tracked element type
- Use the visual selector to click directly on the number on the page, or manually enter an XPath/CSS selector if you prefer
The visual selector is the easiest way - just point and click on the number you want to track. PageCrawl will figure out the selector for you automatically.
Using Selectors Manually
If you prefer to manually write selectors by analyzing HTML source, here are some examples:
For a price like this:
<span class="price">$49.99</span>Use: //span[@class="price"] or .price
For an inventory count:
<div class="stock">150 items available</div>Use: //div[@class="stock"] or div.stock
For a specific ID:
<p id="total-views">2,543 views</p>Use: //p[@id="total-views"] or #total-views
For a rating or score:
<span class="rating">4.5</span>Use: //span[@class="rating"] or .rating
How It Works
Once you've set up your number tracker, PageCrawl will:
- Extract the numeric value each time it checks the page
- Store the values over time and build a historical record
- Display all values in a chart so you can see trends at a glance
- Show you when values go up or down and by how much
- Alert you if the number changes by a certain amount (if you configure notification conditions)
The chart displays your complete history, making it easy to spot patterns and see how values change over different time periods. You can see exactly when changes happened and track the progression of any number over days, weeks, or months.
Understanding the Chart
Your number tracking chart shows:
- All previous values recorded over time
- Exact dates and times when each value was captured
- Trends and patterns in how the number changes
- Peaks (highest values) and valleys (lowest values)
- How much the number changed between each check
This gives you a clear visual picture of what's happening with the metric you're tracking.
Statistics Overview
PageCrawl displays comprehensive statistics about your tracked number:
- Data Points: Total number of checks performed and days tracked
- Average: The mean of all recorded values over time
- Median: The middle value, useful for understanding typical values when outliers exist
- First Recorded: The initial value and when tracking began
- Current Value: Your most recent reading with:
- 90-day change comparison
- Distance from average (shows if current value is higher or lower than typical)
- Highest Value: The maximum value ever recorded and when it occurred
- Lowest Value: The minimum value ever recorded and when it occurred
- Total Change: How much the value has changed since you started tracking (absolute and percentage)
- Trend: Overall direction indicator (📈 Up, 📉 Down, or ➡️ Stable)
- Last Changed: When the value actually changed (not just checked)
These statistics are color-coded:
- Green indicates increases or positive changes
- Red indicates decreases or negative changes
- Gray indicates neutral or stable values
This helps you quickly understand the overall behavior of your metric without manually analyzing the chart.
Chart
The chart visualization includes powerful interactive features to help you analyze your data:
Date Range Filters:
- Use the quick filter buttons to view specific time periods:
- Last 7 Days - Recent short-term trends
- Last 30 Days - Monthly patterns
- Last 90 Days - Quarterly trends
- All Time - Complete history
Chart Controls:
- Avg Line: Toggle the average reference line on/off
- Moving Avg: Toggle moving average lines on/off to smooth out short-term fluctuations
- Choose between 7-day or 30-day moving averages
- The moving average line appears as a dashed line in the same color as your data
- Helps identify underlying trends by filtering out daily noise
- Hover over any point to see both the actual value and the moving average
Visual Annotations:
- Average Line: A dashed horizontal line shows the overall average value
- Highest Point: Marked with a red dot and label showing the peak value
- Lowest Point: Marked with a green dot and label showing the minimum value
- Color-Coded Dots: Each data point is colored based on change direction:
- Green dots indicate the value increased from the previous check
- Red dots indicate the value decreased
- Standard color means no change
- Zoom Brush: On desktop, use the brush tool at the bottom to zoom into specific date ranges
Legend:
- Click on any metric name in the legend to show/hide that line
- Disabled lines appear grayed out with a strikethrough
- Perfect for focusing on specific metrics when tracking multiple values
- Click again to re-enable the line
- All reference lines (average, annotations) update based on visible lines
Tooltips: When you hover over any point on the chart, you'll see:
- The exact date and time of the check
- The current value at that point
- Change from the previous check with up/down arrows (▲ ▼)
- The moving average value at that point (if enabled)
- All values are clearly labeled so you know what each number means
Performance Optimizations: For long tracking periods with thousands of data points:
- The chart automatically samples data when viewing "All Time" to maintain smooth performance
- You'll see a note indicating how many points are shown (e.g., "Showing 150 of 500 points")
- This ensures fast, responsive charts even with years of historical data
These features make it easy to spot trends, identify when significant changes occurred, and understand your data at a glance.
Tips for Best Results
- Use the visual selector: Click directly on the number you want to track rather than writing selectors manually
- Check your selector works: Make sure the selector is targeting the right element on the page
- Set reasonable check frequency: How often PageCrawl checks depends on how fast you expect the number to change
- Use templates for multiple pages: If you're tracking the same metric on different pages (like product prices), create a template and apply it to all pages. If you need to update the monitored pages, you will only need to make one change.
Using Templates
If you need to monitor the same numeric value across multiple pages on a website, you can:
- Create a template with your Number tracker configuration
- Apply that template to all the pages you want to monitor
- Compare how the value changes across different pages
This saves you time and makes it easy to track metrics across your entire site.
Comparing Multiple Monitors on One Chart
If you're tracking the same type of number across different pages (for example, the price of a product on multiple retailers), you can overlay them all on a single chart to compare side by side.
How to set it up:
- Open any monitor that has a Number or Price tracked element
- Above the chart, you'll see a "Compare with..." dropdown
- Click it and search for other monitors you want to add by name or URL
- Select the monitors you want to compare. You can add up to 5 monitors on the same chart
PageCrawl will suggest relevant monitors automatically, prioritizing monitors in the same folder, on the same domain, or tracking similar products.
What the combined chart shows:
- Each monitor appears as a separate line in a distinct color
- All data points are merged onto a shared timeline so you can see how values move relative to each other
- The chart legend lists every line. Click any line in the legend to show or hide it
- Hovering over the chart shows a tooltip with the values from all monitors at that point in time
- Date filters, moving averages, and zoom all apply to every line at once
Reading the comparison:
- The Y-axis adjusts automatically to fit all values
- The average, highest, and lowest annotations still apply to the primary monitor
- Comparison data in tooltips is marked with a bullet (●) so you can tell which values belong to the primary monitor and which are from compared monitors
This is especially useful for:
- Competitive price tracking: See how your price compares to competitors over time on one chart
- Cross-retailer monitoring: Track the same product on Amazon, Walmart, and other stores and see price differences instantly
- Regional comparisons: Compare the same metric across different regional pages
- Benchmarking: Overlay your metric against an industry reference point
Your comparison selections are saved, so the next time you open the monitor the same comparison lines will appear on the chart.
Common Examples
E-commerce Store: Track product prices across listings. When prices drop or go on sale, you'll see it immediately in the chart. Compare pricing across multiple product pages to spot trends.
Real Estate Pricing: Track property prices on listing sites. Monitor how prices change over time, identify when properties go on sale, or track pricing trends in your area of interest.
Competitor Pricing: Monitor competitor product prices, discount percentages, or pricing changes. The chart gives you a clear view of when they adjust their prices.
Job Postings: Track how many open positions a company has posted. The chart shows when they're actively hiring and when positions get filled.
Education Programs: Monitor tuition costs, enrollment numbers for programs, or available spots in courses. Track how these metrics change throughout the year.
Government Fees & Services: Monitor permit costs, license fees, visa application prices, or other government service charges that may be subject to change.
Stock Price Monitoring: Monitor the current price of a stock or cryptocurrency. The chart shows you exactly when the price changed and by how much.