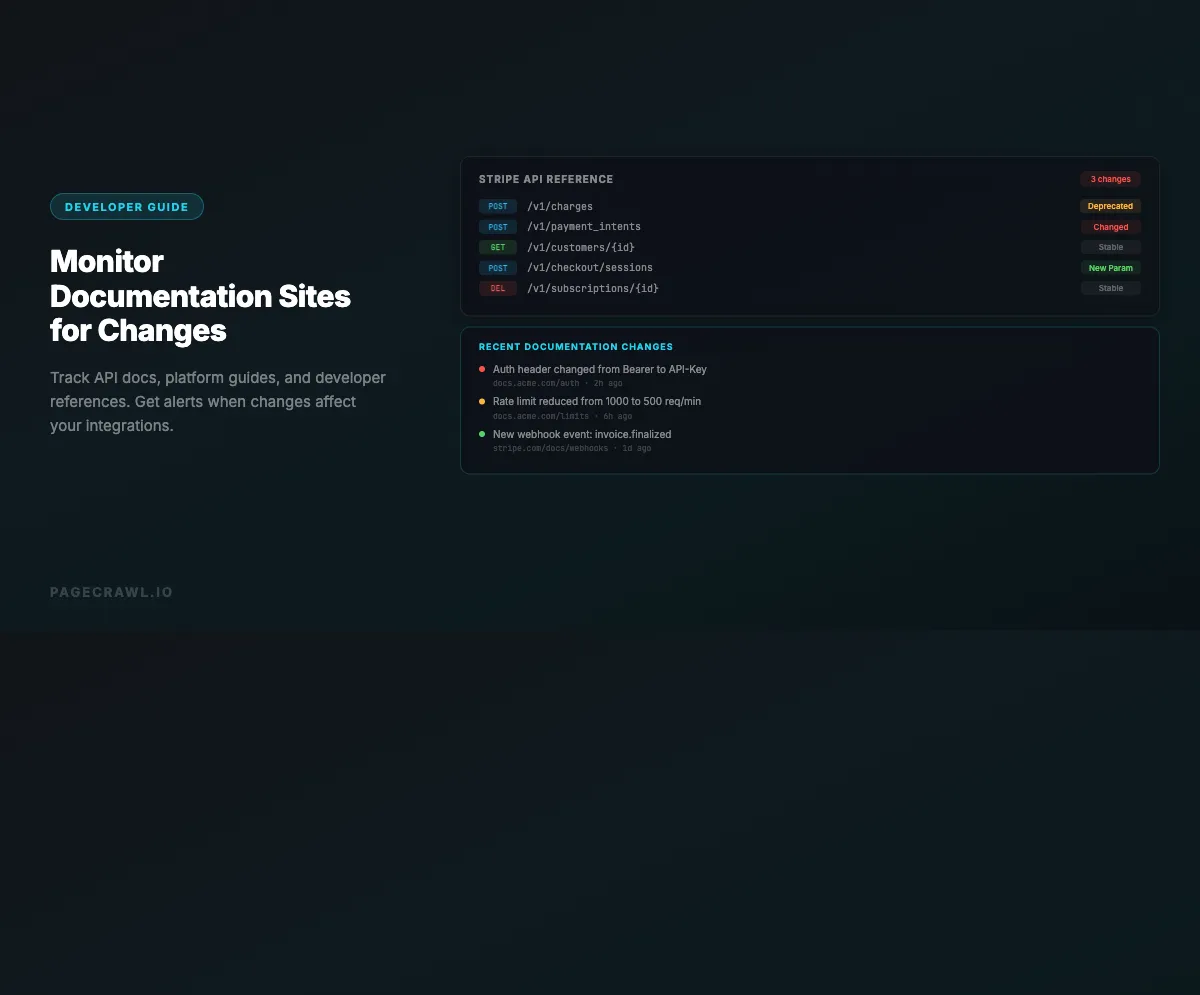
Documentation changes break things. A cloud provider quietly deprecates an API parameter, a SaaS platform changes their authentication flow, a framework updates a method signature. These changes are documented, sometimes buried in release notes, sometimes only reflected in updated documentation pages. If you miss them, you find out the hard way when your integration starts failing in production.
Monitoring documentation sites means setting up automated checks on the pages your team depends on. When the content changes, you get an alert. This turns documentation updates from something you might stumble across into something your team knows about immediately.
This guide covers which documentation to monitor, how to set up effective monitoring, and strategies for different types of documentation sites.
Why Documentation Changes Matter
Breaking Changes Hide in Documentation
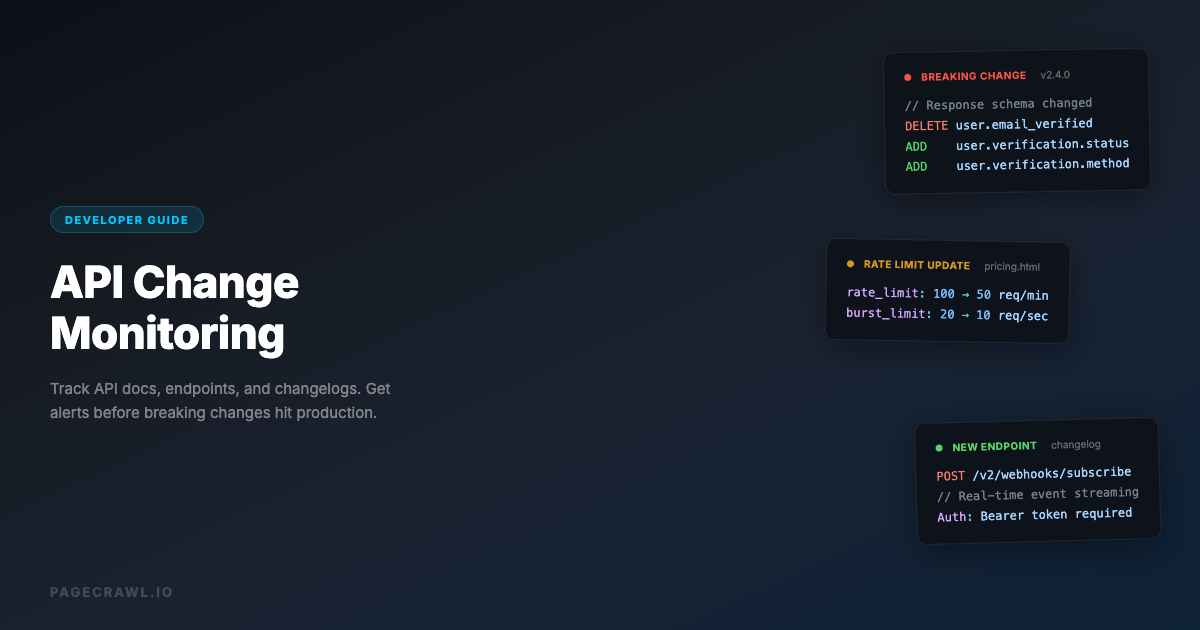
Not every breaking change gets an announcement blog post. API providers update their docs constantly, and many changes happen without fanfare:
Parameter deprecations: A query parameter you rely on stops being documented. It might still work today, but it is on the path to removal.
Authentication changes: OAuth flows get updated, API key formats change, or new security requirements are added.
Rate limit updates: Usage limits change, new tiers are introduced, or throttling behavior is modified.
Response format changes: Fields are renamed, data types change, or new required fields are added to API responses. For a focused guide on catching these issues, see how to monitor REST APIs for breaking changes.
SDK updates: Client library documentation shows new method signatures, deprecated functions, or changed default behaviors. You can also monitor GitHub releases and changelogs for the libraries you depend on to catch these changes at the source.
If your team reads the documentation when building an integration and then never checks it again, you are relying on luck to catch breaking changes.
Documentation as a Leading Indicator
Documentation updates often precede actual changes. A new deprecation notice in the docs might mean the feature still works but will be removed in 6 months. Catching this early gives your team time to plan migration instead of scrambling when the feature actually breaks.
Similarly, new features often appear in documentation before they are announced. Monitoring competitor or platform documentation can reveal upcoming capabilities before the marketing announcement.
Compliance and Audit Requirements
Some industries require teams to document which versions of APIs and platforms they integrate with. Tracking documentation changes creates an audit trail of what the documentation said when you built your integration versus what it says now.

What Documentation to Monitor
API Reference Pages
These are the most critical pages to track. API reference documentation defines the exact interface your code talks to.
Endpoint documentation: The page for each API endpoint you use. Monitor for changes to parameters, request/response formats, and authentication requirements.
Authentication pages: How to authenticate with the API. Changes here can immediately break your integration.
Rate limiting pages: Current limits, quotas, and throttling behavior. Changes affect how you design your client code.
Error code pages: New error codes mean new failure modes your code needs to handle.
Versioning/migration pages: These pages tell you when versions are being deprecated and what you need to change.
Platform Documentation
Documentation for the platforms your application runs on:
Cloud provider docs: AWS, GCP, Azure service documentation for the services you use. Configuration options, limits, pricing, and behavior changes.
Framework docs: Documentation for your web framework, ORM, testing framework, and other core dependencies.
Database docs: Configuration options, query syntax, performance recommendations, and version-specific behavior.
Infrastructure docs: Kubernetes, Docker, Terraform, and other infrastructure tool documentation.
Third-Party Service Documentation
Documentation for services your application integrates with:
Payment processors: Stripe, PayPal, Square API documentation. Changes here can affect revenue.
Communication services: Twilio, SendGrid, Slack API docs. Changes affect notifications and messaging.
Analytics services: Google Analytics, Mixpanel, Amplitude documentation. Changes affect data collection and reporting.
Identity providers: Auth0, Okta, Firebase Auth documentation. Changes affect user authentication.
Setting Up Documentation Monitoring
Step 1: Inventory Your Dependencies
Before you can monitor documentation, you need to know what to monitor. Create a list of:
- External APIs your application calls directly
- SDKs and client libraries you use
- Platform services you depend on (hosting, CDN, DNS, email)
- Development tools your team uses daily
For each dependency, find the documentation URL. Most API providers have stable documentation URLs like docs.example.com/api/v2/users or developer.example.com/reference/authentication.
Step 2: Prioritize by Risk
Not all documentation changes carry equal risk. Prioritize monitoring based on:
Critical (monitor hourly to daily):
- Authentication and authorization documentation
- API endpoints you call in production
- Payment processing documentation
- Core platform service documentation
Important (monitor daily):
- SDK and client library documentation
- Rate limiting and usage documentation
- Error handling documentation
- Migration and upgrade guides
Informational (monitor weekly):
- Best practices and tutorial pages
- Changelog and release notes pages
- Getting started guides
- Feature comparison pages
Step 3: Choose Monitoring Approach
Different types of documentation pages need different monitoring strategies:
Full page text monitoring: Best for API reference pages where any text change could be significant. Catches additions, removals, and modifications to any content on the page.
Reader mode monitoring: Best for documentation pages with heavy navigation, sidebars, and UI elements. Reader mode extracts the main content and ignores layout elements, reducing false alerts from UI changes.
Specific element monitoring: Best when you only care about a specific section of a documentation page, like the "Parameters" table or the "Authentication" section. Use a CSS selector to target just that element.
Visual monitoring: Useful for documentation pages where formatting changes matter, such as when code examples are reformatted or tables are restructured.
Step 4: Configure Alerts
Route documentation change alerts to the right team:
Engineering Slack channel: For API reference changes that might require code updates.
Email to tech leads: For platform documentation changes that need architectural review.
Webhook to project management: For changes that should be tracked as tasks (migration planning, version updates).
Use AI-powered change summaries to quickly understand what changed without reading the full diff. A summary like "Added new required header X-Api-Version to all endpoints" is immediately actionable.
Monitoring Strategies by Documentation Type
REST API Documentation
REST API docs typically have a page per endpoint with method, URL, parameters, headers, request body, and response format.
What to monitor: The reference page for each endpoint you use. Focus on the endpoints you call most frequently or that handle critical operations (payments, authentication, data mutations).
What changes look like: New parameters added, parameters deprecated, response fields renamed, authentication requirements changed, or new error codes added.
Check frequency: Daily for production APIs. Weekly for APIs in development or staging only.
Practical setup: Create one monitor per API endpoint documentation page. Group them in a folder named after the API provider. Use text monitoring to catch all changes.
GraphQL API Documentation
GraphQL APIs have schema documentation that defines types, queries, mutations, and subscriptions.
What to monitor: The schema documentation page, the query reference, and any migration guides. GraphQL schema changes can be more subtle than REST because the schema is interconnected.
What changes look like: New types added, fields deprecated on existing types, argument changes on queries or mutations, new directives.
Check frequency: Daily. GraphQL schema changes can cascade through your queries.
SDK and Library Documentation
SDK documentation covers installation, configuration, method reference, and migration guides.
What to monitor: The getting started page (for installation changes), the API reference (for method signature changes), and the migration guide (for upcoming breaking changes).
What changes look like: New methods added, method signatures changed (new required parameters), deprecated methods removed, configuration option changes.
Check frequency: Weekly for stable SDKs. Daily for SDKs in active development or during major version transitions.
Changelog and Release Notes
Many documentation sites have a changelog or release notes page that summarizes all recent changes.
What to monitor: The changelog page itself. This is often the single best page to monitor because it aggregates all changes in one place. Many projects also publish changelogs through RSS feeds, which you can monitor directly.
What changes look like: New entries added to the top of the page describing what changed in the latest release.
Check frequency: Daily. Changelogs are updated less frequently than individual documentation pages and provide a curated summary of changes.
Platform Status and Known Issues
Some documentation sites include status pages or known issues lists.
What to monitor: The known issues page and any status page. These reveal current problems that might affect your integration.
What changes look like: New issues added, existing issues resolved, or status changes for services you depend on.
Check frequency: Every few hours for critical platforms.
Common Documentation Monitoring Scenarios
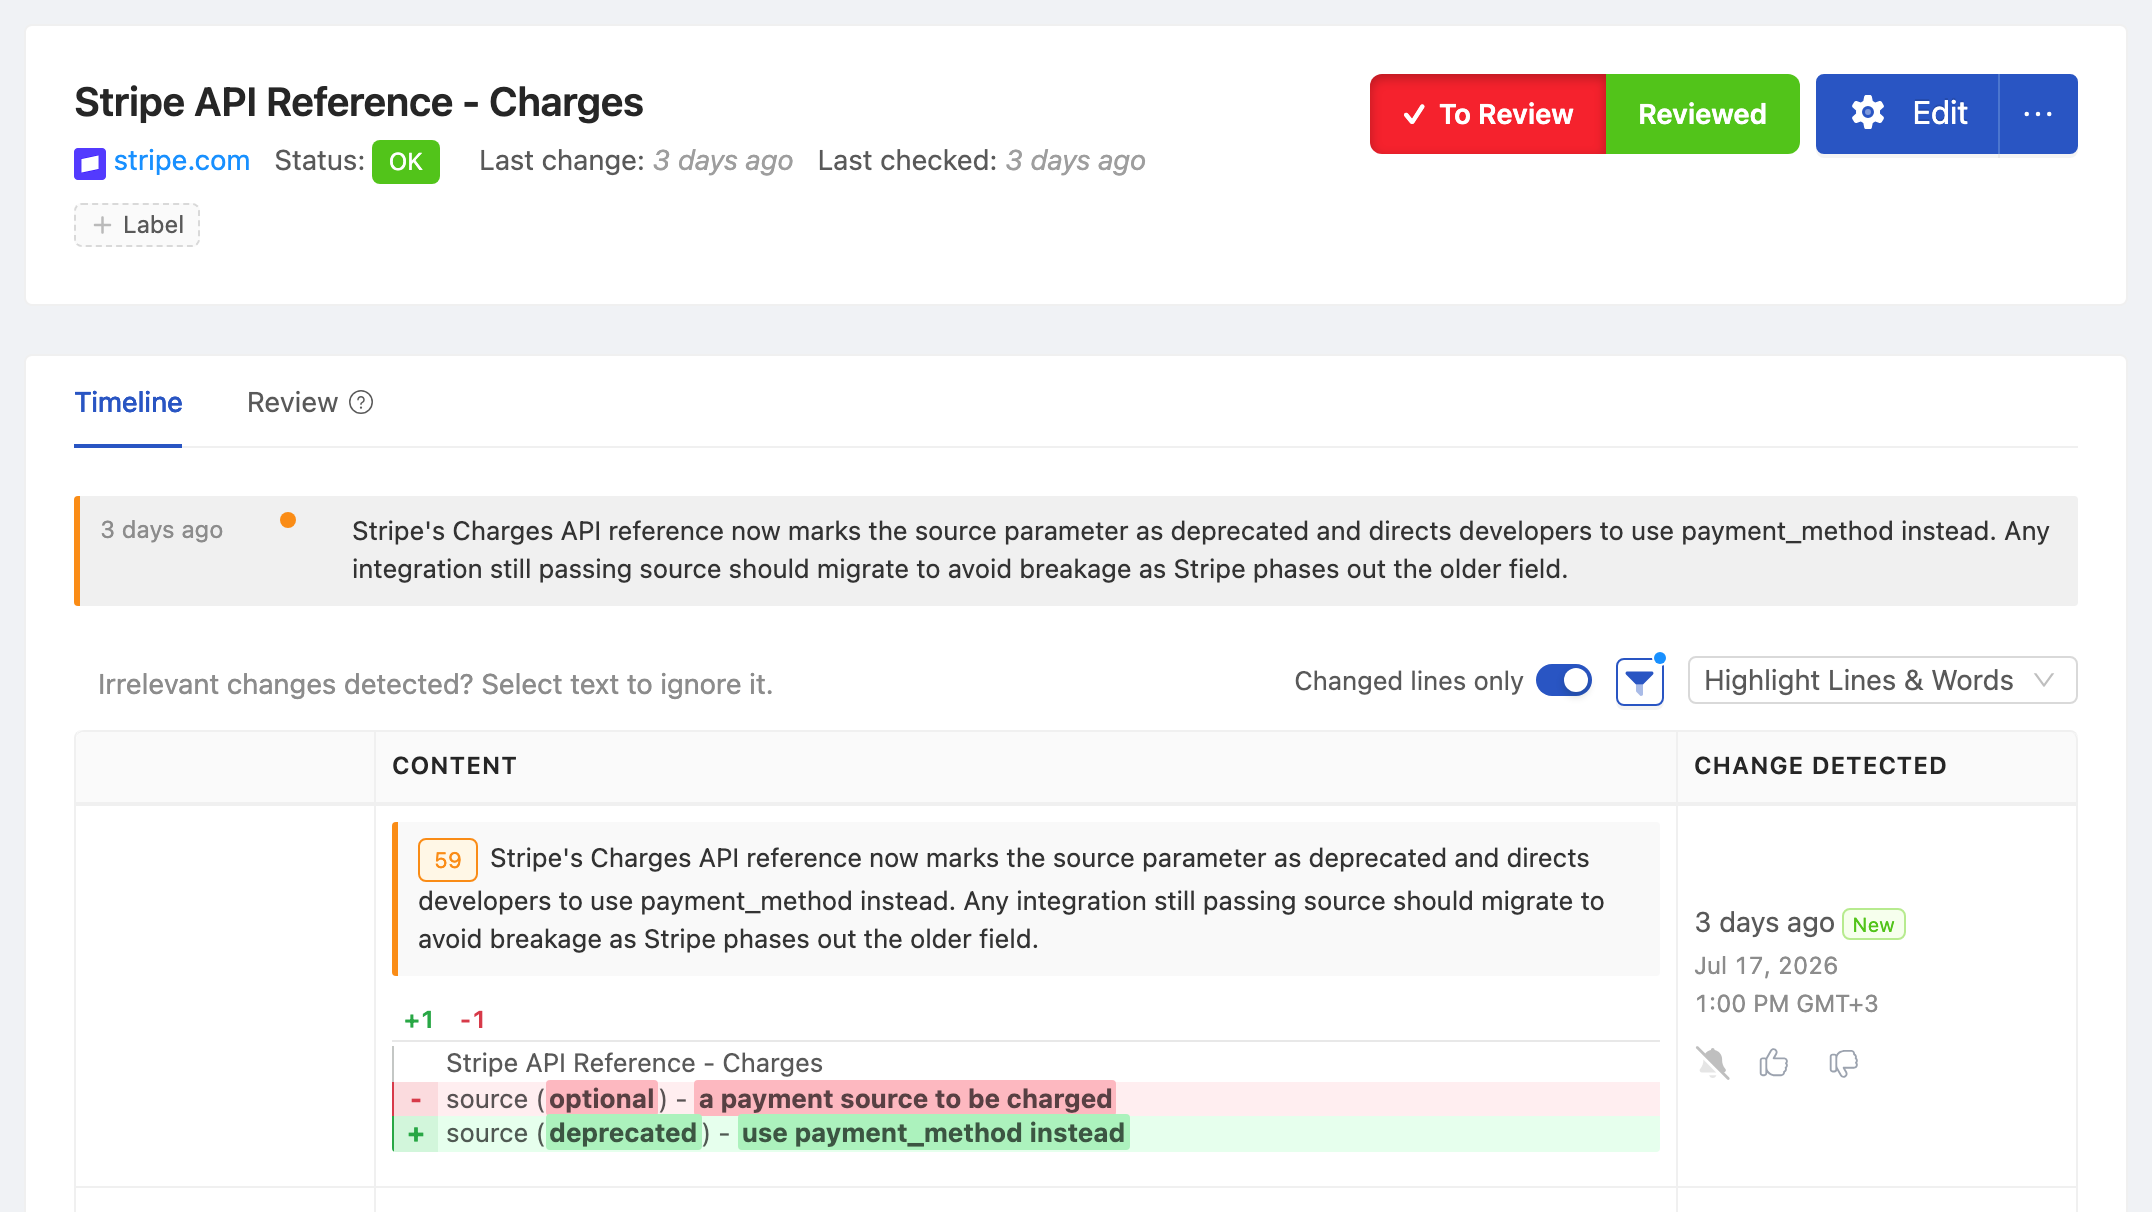
Catching a Deprecation Before It Breaks
The scenario: Stripe updates their API documentation to mark the source parameter as deprecated on the charges endpoint, recommending payment_method instead.
With monitoring: Your daily documentation monitor catches the deprecation notice. The engineering team creates a migration task, plans the update, and deploys the change over the next sprint. No customer impact.
Without monitoring: You find out about the deprecation when Stripe removes support for source six months later and your payment integration breaks in production.
Tracking Platform Configuration Changes
The scenario: AWS updates their S3 documentation to change the default behavior for new bucket ACLs, switching from public to private by default.
With monitoring: The documentation change alert reaches your infrastructure team. They review their Terraform configurations and deployment scripts, updating any that relied on the previous default behavior before it causes issues.
Without monitoring: New S3 buckets created by your deployment pipeline have unexpected access restrictions, causing 403 errors for assets that should be publicly accessible.
Monitoring Competitor API Documentation
The scenario: A competitor's API documentation adds new endpoints for a feature that your platform also offers.
With monitoring: Your product team sees the documentation change within a day. They analyze the competitor's approach, identify any ideas worth incorporating, and adjust their roadmap if needed.
Without monitoring: You learn about the competitor's new feature when their marketing team announces it, weeks after the documentation was published.
Handling Common Challenges
Documentation Sites That Change Frequently
Some documentation sites update their UI, navigation, or footer content frequently. These changes trigger alerts that are not about the actual documentation content.
Solution: Use reader mode monitoring to strip away navigation and UI elements. If that is not sufficient, use CSS selectors to target only the main content area of the documentation page.
Single Page Applications (SPAs)
Many modern documentation sites (like those built with Docusaurus, GitBook, or ReadTheDocs) are SPAs where content loads dynamically with JavaScript.
Solution: Use browser-based monitoring that renders JavaScript and waits for content to load. Simple HTTP-based monitoring will not capture the rendered content of SPA documentation sites.
Documentation Behind Authentication
Some API documentation requires authentication to access, especially for internal APIs or premium documentation.
Solution: Use monitoring tools that support authenticated sessions. Some tools allow you to provide login credentials or session cookies to access protected documentation pages.
Large Documentation Pages
Some API references have very long pages with hundreds of endpoints listed on a single page.
Solution: Use specific element monitoring to target the section you care about. For example, use a CSS selector that targets the documentation section for a specific endpoint rather than monitoring the entire page.
Versioned Documentation
Many API docs have multiple versions (v1, v2, v3). You need to monitor the version you are currently using plus the next version.
Solution: Set up separate monitors for each API version you care about. Monitor your current version for changes that might affect your existing integration, and monitor the next version to plan your migration.
Building a Documentation Monitoring Dashboard
Organizing your documentation monitors makes them useful for your whole team.
Group by provider: Create folders for each API provider or platform. "Stripe API", "AWS Services", "Internal APIs".
Group by criticality: Tag monitors as critical, important, or informational so you can filter alerts by urgency.
Group by team: If different teams own different integrations, tag monitors with the responsible team name.
Include metadata: In the monitor name or notes, include the version of the API you use, the date you last reviewed the documentation, and any relevant ticket numbers for planned migrations.
Automating Responses to Documentation Changes
Beyond just alerting, you can automate your team's response to documentation changes:
Create tickets automatically: When documentation changes, send a webhook to your project management tool to create a review task for the responsible team.
Update internal wikis: If you maintain internal documentation about your integrations, documentation changes should trigger a review of your internal docs.
Run integration tests: For critical API documentation changes, trigger your integration test suite to verify that your current code still works with the documented behavior.
Notify stakeholders: Route different types of changes to different people. Authentication changes go to security, pricing changes go to product, deprecation notices go to engineering.
Choosing your PageCrawl plan
PageCrawl's Free plan lets you monitor 6 pages with 220 checks per month, which is enough to validate the approach on your most critical pages. Most teams graduate to a paid plan once they see the value.
| Plan | Price | Pages | Checks / month | Frequency |
|---|---|---|---|---|
| Free | $0 | 6 | 220 | every 60 min |
| Standard | $8/mo or $80/yr | 100 | 15,000 | every 15 min |
| Enterprise | $30/mo or $300/yr | 500 | 100,000 | every 5 min |
| Ultimate | $99/mo or $999/yr | 1,000 | 100,000 | every 2 min |
Annual billing saves two months across every paid tier. Enterprise and Ultimate scale up to 100x if you need thousands of pages or multi-team access.
At an engineering hourly rate, Standard at $80/year pays for itself the first time it catches a deprecation notice or authentication change before your integration breaks in production. 100 pages covers the changelogs, API reference sections, and migration guides for every external dependency a typical engineering team relies on. Enterprise at $300/year expands to 500 pages for teams with broad API footprints or multiple products, with 5-minute check frequency for the most critical documentation. All plans include the PageCrawl MCP Server, so developers can ask directly in Claude or Cursor what changed in the Stripe or AWS docs this week and get a plain-language summary from their own monitoring history rather than reading diffs. AI assistants can create monitors through conversation on every plan, including Free.
Getting Started
Set up documentation monitoring in three steps:
Monitor your top 5 API dependencies. Find the documentation page for each external API your application calls. Set up text monitoring with daily checks. Route alerts to your engineering team's Slack channel.
Add changelog pages. For each API provider, find their changelog or release notes page. These pages aggregate all changes in one place, making them the most efficient pages to monitor.
Expand to platform documentation. Add monitors for your cloud provider's documentation on the services you use. Monitor the pages for configuration options, limits, and behavior changes that could affect your application.
This foundation ensures your team knows about documentation changes within 24 hours instead of discovering them when something breaks.