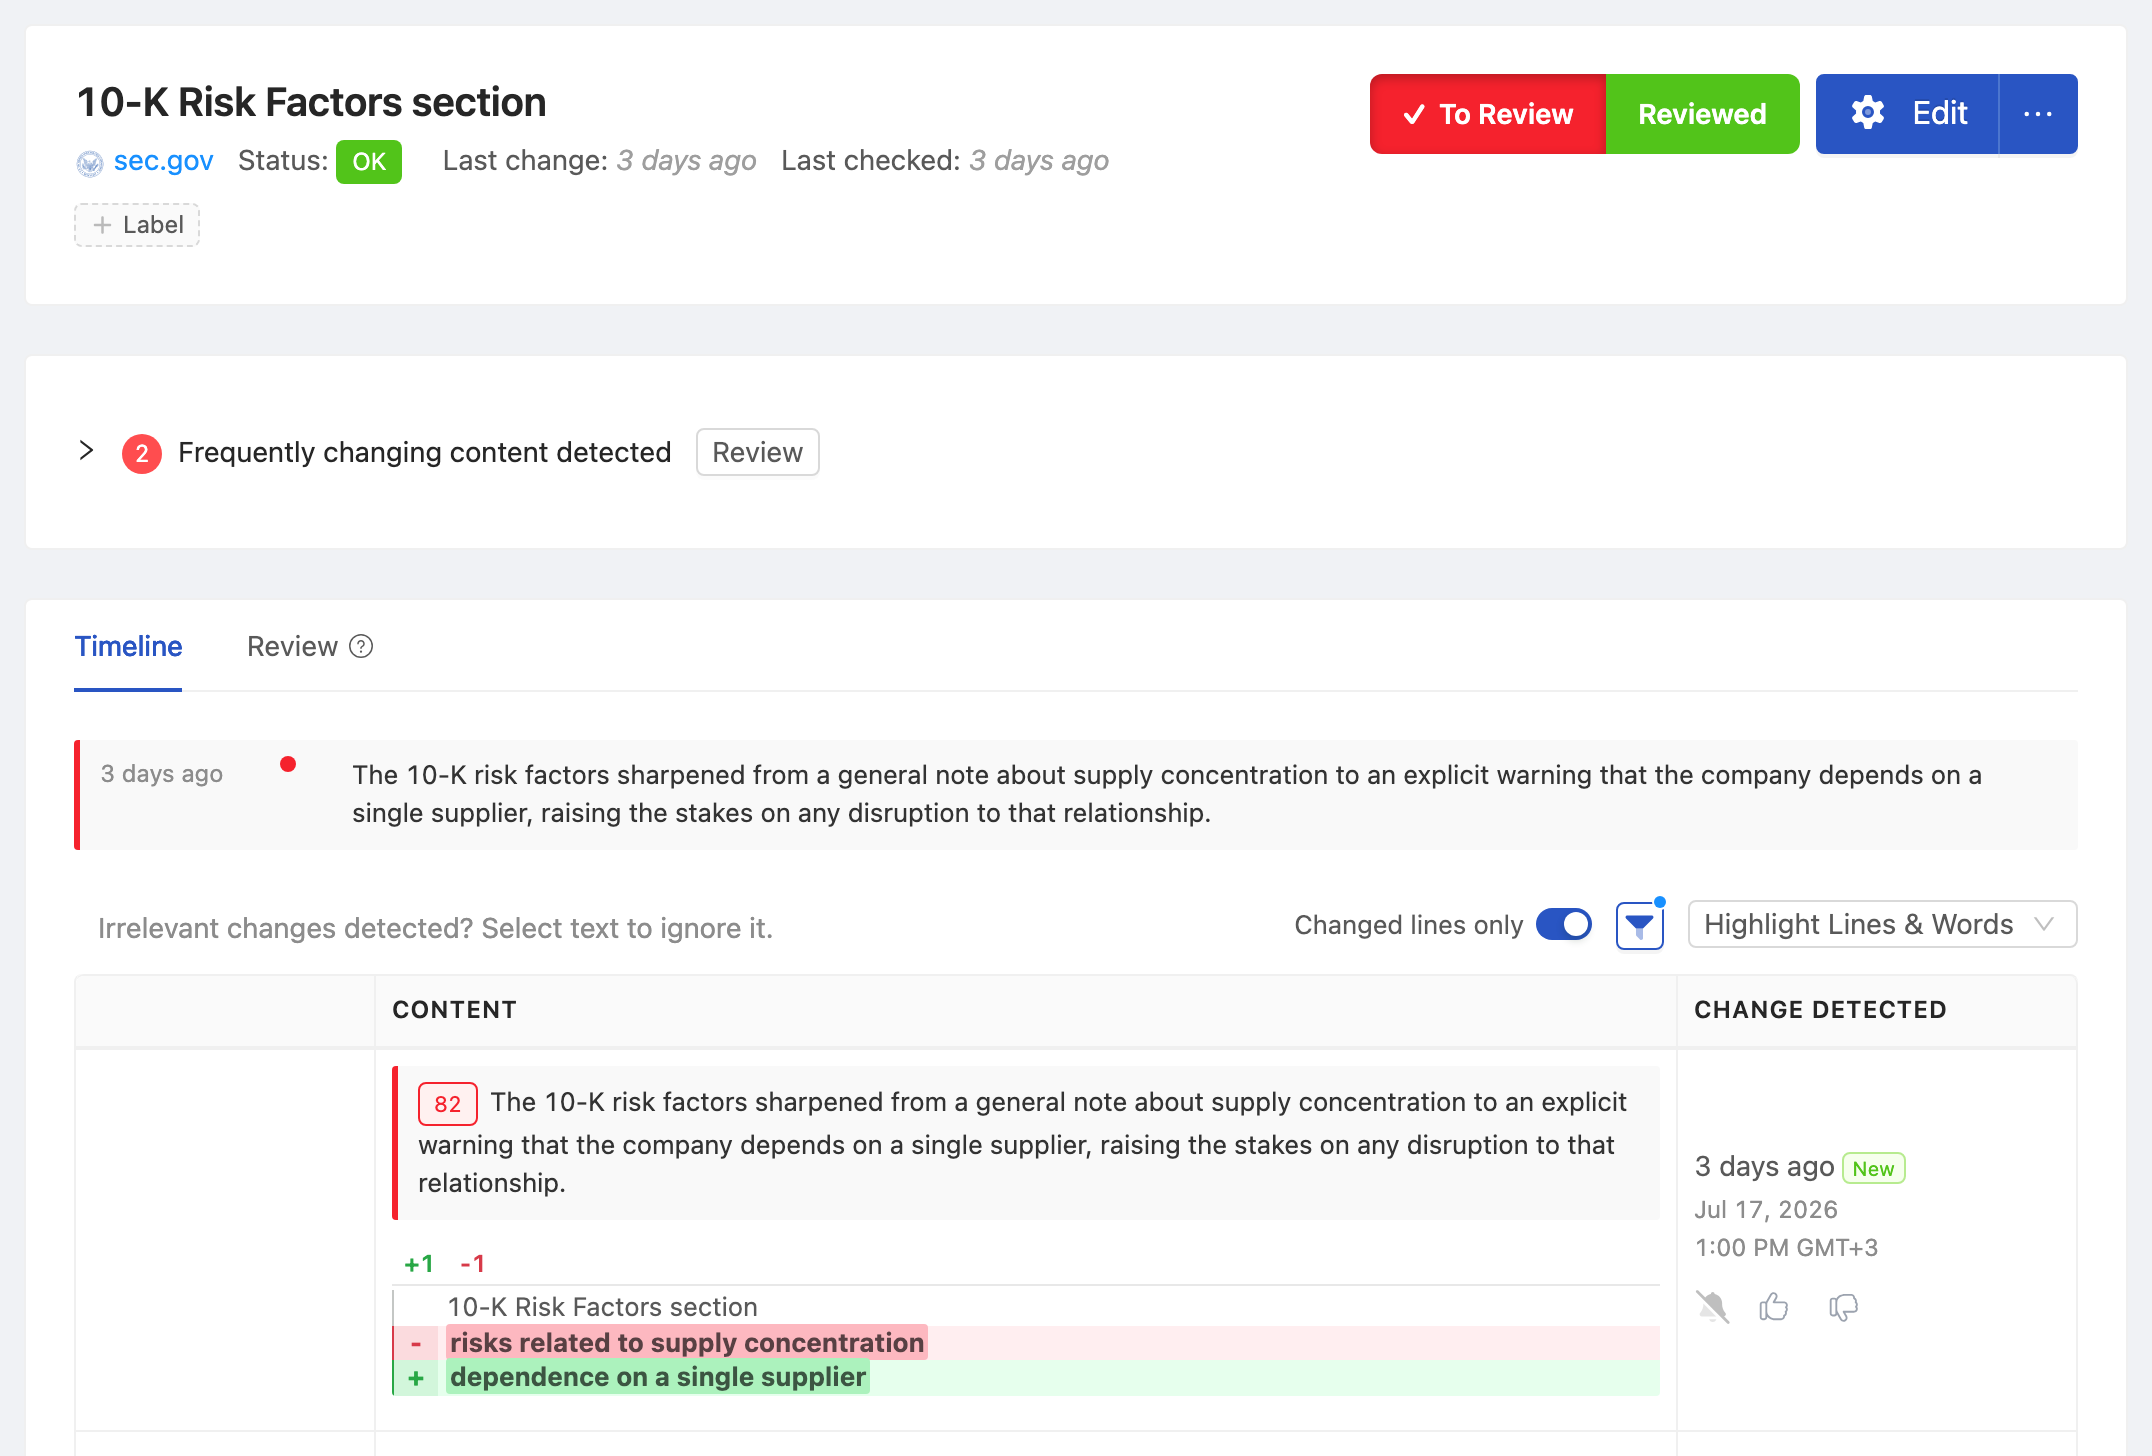
A company files its 10-K on a Friday afternoon. Buried on page 47, a single risk-factor paragraph gets reworded: "supply concentration" quietly becomes "dependence on a single supplier." No press release, no headline, no analyst note. The stock does not move that day. Three weeks later, the supplier issue surfaces publicly and the stock gaps down 12%. The signal was sitting in a public filing the whole time. The problem was never access to the data, it was noticing the change in time.
That is the gap most investment research tools leave open. They are excellent at telling you what a company is worth today. They are much weaker at telling you the moment something changes: a new filing, a revised disclosure, a tweaked guidance page on an investor relations site. Research is a snapshot. Markets move on the delta.
This guide compares the 10 best investment research tools for 2026 across every major category: fundamentals platforms, screeners, filings and document research, analyst ratings, and the alerting layer that ties them together. It is an honest comparison, including where each tool stops and where you need something else.
What are investment research tools, and which categories matter?
Investment research tools are software platforms that help you find, analyze, and track investments. They split into five categories: fundamentals and valuation platforms, stock screeners, filings and document research, analyst ratings and news, and alerting or web-monitoring tools. Most investors combine three or four, since no single tool covers all five well.
The right stack depends on what kind of investor you are: value investors lean on fundamentals and filings, momentum traders on screeners and real-time alerts. Everyone benefits from the monitoring layer, the category most retail investors skip and most professionals automate. The five categories break down like this:
- Fundamentals and valuation platforms (Morningstar, Koyfin, Stock Rover): financial statements, multiples, and analyst estimates. They tell you whether a company is worth owning, but describe the present, not the moment something shifts.
- Stock screeners (Finviz, Stock Rover): filter the whole market by rules you set, like P/E under 15 or revenue growth over 20%. Great for finding ideas, but they re-run on a schedule rather than streaming live.
- Filings and document research (SEC EDGAR, AlphaSense): 10-Ks, 10-Qs, 8-Ks, proxy statements, and institutional disclosures. The hard part is not finding filings, it is catching what changed versus the last version.
- Alternative data and web monitoring (PageCrawl): hiring pages, pricing changes, store counts, app reviews, and IR-page edits. The fastest-growing category, where alternative data pipelines built on web monitoring turn public pages into structured, timestamped signals.
- News, ratings, and community research (Seeking Alpha, TipRanks): analyst ratings, price targets, and earnings transcripts. Useful for a second opinion, but ratings lag price.
What should you look for in an investment research tool?
The best investment research tool for you depends on four things: data coverage and freshness, how fast it alerts you to change, whether you need depth or breadth, and what you can afford. A free screener plus EDGAR plus a monitoring layer beats an expensive terminal you barely use.
Data coverage and freshness
Coverage is the universe the tool sees (US large caps, global equities, ETFs, fixed income). Freshness is how current that data is. Quarterly fundamentals are fine for valuation but useless for catching a same-day guidance change. Match the tool's cadence to the decision you are making with it.
Timeliness and alerting
Research you read three days late is history, not an edge. Favor tools that push notifications when something changes instead of waiting for you to log in. The ability to set conditional alerts that only fire when your rules are met, such as a keyword appearing in a filing, is the difference between a feed and a firehose.
Depth versus breadth
Some tools go deep on individual names (Morningstar's reports, AlphaSense's document search); others go broad across the market (Finviz screens, EDGAR's full filing universe). Concentrated investors who hold 15 positions want depth and change-tracking on those 15; idea-hunters want breadth and filters.
Cost and accessibility
Pricing spans from free (EDGAR, Finviz basic, Stock Rover's free tier) to roughly $300 per year (Seeking Alpha) to over $25,000 per year (Bloomberg Terminal). Expensive does not mean better for your use case: a retail investor can assemble a professional-grade stack for under $200 a year by pairing free primary sources with a focused monitoring layer.
Which are the 10 best investment research tools for 2026?
We evaluated each tool on coverage, freshness, alerting, and value. Here is an honest look at the 10 best, starting with the monitoring layer that connects the rest.
1. PageCrawl
Type: Web monitoring and change-detection layer for filings, IR pages, and news Starting price: Free (6 monitors), $8/month (100 monitors), $30/month (500 monitors)
PageCrawl is not a valuation tool and does not replace Morningstar or Bloomberg. It is the alerting layer that watches any web page that matters to a thesis and tells you the moment it changes. Point it at an SEC filing index, an IR page, a pricing page, or a news search, and it checks on a schedule and notifies you with an AI summary of what changed.
Research features:
- Tracks any public web page: filing indexes, IR pages, 8-K disclosures, pricing and hiring pages
- AI summaries in plain English ("Risk factors added a new paragraph on supplier concentration")
- Word-level diff history, plus number and price tracking for specific figures over time
- Conditional alerts that fire only on your keyword or threshold rule
- Notifications via Slack, Discord, Telegram, Teams, email, and webhooks
Strengths:
- Works on any website, not a fixed data vendor's universe. If it is on the public web, you can monitor it.
- Catches the delta. Most research tools show the current state; PageCrawl shows what changed and when.
- Free tier includes the full feature set for 6 monitors, with purpose-built guides for event-driven investing signals and risk-factor changes between 10-K and 10-Q filings.
Limitations:
- Not a fundamentals or valuation platform. Pair it with a research tool for the analysis itself.
- You decide what to monitor; it does not surface ideas on its own.
Best for: Investors who do their analysis elsewhere and want to stop missing the moment a filing, disclosure, or IR page changes.
2. Morningstar Investor
Type: Fundamentals, fund research, and independent ratings Starting price: About $35/month or $249/year
Morningstar is the reference standard for mutual fund and ETF research, with star ratings, analyst reports, and fair-value estimates. For long-term investors who care about quality and moats, the editorial analysis is genuinely useful.
Strengths:
- Deep, human-written analyst reports, fair-value estimates, and moat ratings
- Strong portfolio analysis and fund-overlap tools
Limitations:
- Update cadence suits buy-and-hold, not fast-moving situations
- No real-time change alerting on filings or web pages
Best for: Long-term and fund-focused investors who want independent ratings.
3. Koyfin
Type: Charts, fundamentals, and dashboards Starting price: Free tier, paid plans from about $49/month
Koyfin is the closest thing to an affordable Bloomberg-lite for visual analysis, excelling at custom dashboards, historical financial charts, macro data, and side-by-side company comparisons.
Strengths:
- Excellent fundamental charting and multi-company comparison views
- Macro, FX, and fixed-income data alongside equities
Limitations:
- The most useful features sit behind the higher paid tiers
- Filing search is shallow, and alerting is price-focused, not document-change focused
Best for: Analysts who want visual, dashboard-driven research without terminal pricing.
4. Finviz
Type: Stock screener and market visualization Starting price: Free; Finviz Elite about $39.50/month
Finviz is the fastest free screener on the market and the tool most traders open first every morning, thanks to its market heat map, dozens of filters, and clean visual presentation.
Strengths:
- Powerful, fast screener with technical and fundamental filters
- Iconic market heat map; generous free tier, with Elite adding real-time data
Limitations:
- Shallow on deep fundamentals and filings
- Screens re-run on demand, so it is not a live change feed
Best for: Traders and idea-hunters who need a fast, visual screener.
5. Stock Rover
Type: Screener plus deep fundamentals and portfolio analytics Starting price: Free tier; Premium about $28/month, Premium Plus about $42/month
Stock Rover splits the difference between a screener and a fundamentals platform, with 10-plus years of financial history, hundreds of metrics, and strong dividend and portfolio analysis.
Strengths:
- Deep historical fundamentals and a flexible screener in one tool
- Excellent dividend, income, and portfolio analytics
Limitations:
- Dense interface with a real learning curve
- North America focused, with limited real-time and document-change alerting
Best for: Long-term value and dividend investors who want screening plus fundamentals.
6. Seeking Alpha
Type: Research articles, ratings, news, and earnings transcripts Starting price: Premium about $299/year
Seeking Alpha combines crowd-sourced analysis, quant ratings, news, and one of the best libraries of earnings-call transcripts. Its Quant Rating distills dozens of factors into one grade.
Strengths:
- Large library of investment theses and earnings transcripts
- Quant ratings and factor grades for fast screening of a name
- Active comment threads that surface bear and bull cases
Limitations:
- Article quality varies widely, and most ratings and transcripts are paywalled
- Ratings lag price action
Best for: Investors who want a second opinion, sentiment, and transcripts together.
7. SEC EDGAR
Type: Primary source for US regulatory filings Starting price: Free
EDGAR is the official, free home of every US public-company filing: 10-Ks, 10-Qs, 8-Ks, proxy statements, and insider transactions. Every other filings tool is reselling this data, so the source costs nothing and is always first.
Strengths:
- Authoritative, complete, free, and full-text searchable
- The original source, so no vendor delay
Limitations:
- Bare-bones interface with no analysis or summarization
- No native change alerts, so you must check or layer a monitor on top
Best for: Primary filing research, paired with a monitor to catch new and changed filings. For specific flows, see guides on insider buys and sells via Form 4 and 13F institutional holdings changes.
8. AlphaSense
Type: AI document intelligence and market research search Starting price: Enterprise (custom, typically several thousand dollars per seat per year)
AlphaSense is the professional document-research platform. It indexes filings, transcripts, broker research, and expert-call libraries, then lets you search all of it with AI-powered semantic search and sentiment analysis.
Strengths:
- Semantic search across filings, transcripts, and broker research in one place
- AI summarization, sentiment scoring, and smart synonyms on dense documents
Limitations:
- Enterprise pricing puts it out of reach for most individuals
- Focused on documents, not real-time web page changes
Best for: Professional research teams searching and summarizing large document sets.
9. Bloomberg Terminal
Type: All-in-one institutional research, data, and trading Starting price: Roughly $2,500 to $3,000 per month (about $30,000 per year)
The Bloomberg Terminal remains the institutional gold standard: real-time data on every asset class, news, analytics, messaging, and trade execution in one system.
Strengths:
- Unmatched breadth across asset classes and geographies
- Real-time data, news, the standard messaging network, and deep cross-asset analytics
Limitations:
- Cost is prohibitive for individuals and small funds
- Steep learning curve, and far more than most investors need
Best for: Institutional desks that need real-time, cross-asset coverage and can justify the cost.
10. TipRanks
Type: Analyst ratings, price targets, and performance tracking Starting price: Free tier; Premium about $30 to $50/month
TipRanks scores the track record of every analyst and financial blogger, then aggregates their ratings into a single picture per stock, weighting price targets by historical accuracy rather than treating them all equally.
Strengths:
- Analyst and blogger ratings weighted by measured accuracy
- Aggregated price targets, consensus views, and insider activity dashboards
Limitations:
- Ratings and targets are backward-looking, and the best dashboards are paywalled
- Best as a confirmation tool, not a primary research engine
Best for: Investors gauging analyst consensus and accuracy at a glance.
How do the top investment research tools compare?
No single tool wins every category. Fundamentals platforms win on depth, screeners on idea generation, EDGAR on primary filings, and a monitoring layer on catching change in time. The table below maps each tool to what it does best, so you can assemble a stack instead of chasing one do-everything product.
| Tool | Category | Best for | Real-time change alerts | Starting price |
|---|---|---|---|---|
| PageCrawl | Web monitoring | Catching filing/IR/news changes | Yes | Free |
| Morningstar Investor | Fundamentals | Funds and long-term ratings | No | $249/yr |
| Koyfin | Fundamentals/charts | Visual dashboards | Price only | Free / $49/mo |
| Finviz | Screener | Fast idea generation | Elite only | Free / $39.50/mo |
| Stock Rover | Screener/fundamentals | Dividend and value depth | Limited | Free / $28/mo |
| Seeking Alpha | News/ratings | Theses and transcripts | Limited | $299/yr |
| SEC EDGAR | Filings | Primary source filings | No | Free |
| AlphaSense | Document research | Searching large doc sets | Limited | Enterprise |
| Bloomberg Terminal | All-in-one | Institutional coverage | Yes | ~$30,000/yr |
| TipRanks | Ratings | Analyst consensus | Limited | Free / $30/mo |
How do you build a monitoring layer for investment research?
The monitoring layer is the piece almost every retail stack is missing, and it is the cheapest to add. The workflow: pick the pages that move your thesis, monitor them on a schedule, and route changes to where you will see them. Here is how to set it up with PageCrawl on the free tier of 6 monitors and 220 checks per month.
Step 1: List the pages that move your thesis
For each position, write down the URLs that would change your view: the company's SEC filing index, its investor relations and press-release pages, and a news search for its name. Six positions covers a focused portfolio on the free tier.
Step 2: Add a monitor for each page
Paste a URL into PageCrawl and pick a tracking mode: reader mode for filings and press releases, number or price mode for specific figures like a quoted yield, and full-page mode for IR landing pages where layout matters.
Step 3: Set the AI summary focus
Tell the AI what you care about so summaries stay relevant. For a 10-K monitor, focus it on "risk factors, guidance, debt levels, and accounting policies." For an IR page, use "new filings, earnings dates, dividends, and management changes." The summary then leads with what matters.
Step 4: Add conditional rules to cut noise
Filings and IR pages change for trivial reasons. Add conditional alerts so you are only notified when a real signal appears, such as the words "guidance," "restate," or "dilution" entering a document, or a tracked number crossing a threshold.
Step 5: Route alerts to where you work
Send changes to the channel you check most. A dedicated Slack channel for change alerts works well for active investors; email or a daily digest suits a measured cadence. For automated workflows, send a webhook into your dashboard or spreadsheet for a timestamped log.
Step 6: Set the check frequency
Match cadence to the asset. Earnings season warrants frequent checks; a stable dividend holding can be checked daily. The free tier checks every 60 minutes, fast enough for most filing and IR monitoring. Paid plans drop to 15-, 5-, and 2-minute intervals.
Where does web monitoring fit in an investment research stack?
Web monitoring is the connective tissue between your research tools and your decisions. Fundamentals platforms tell you what a company is worth and filings hold the facts, but none of them ping you the instant a fact changes. Monitoring closes that loop by watching the exact pages your thesis depends on and alerting you to the delta.
This matters most for time-sensitive, public-web signals that traditional tools surface late or not at all. Examples investors automate with PageCrawl:
- New and amended filings, by monitoring a company's EDGAR index for the moment an 8-K or 10-Q posts
- Risk-language drift, by diffing 10-K and 10-Q risk factors quarter over quarter
- Central-bank policy shifts, by tracking word-level changes in FOMC statements
- Fund and ETF flows, by watching ETF holdings composition updates and 13F disclosures
- New issuance, by tracking S-1 filings for upcoming IPOs
- Alternative data, by building alternative data pipelines from hiring pages, pricing changes, and app updates
The point is not to replace your research platform, but to make sure the research you trust is acting on current information, not last week's snapshot.
Choosing your PageCrawl plan
PageCrawl's Free plan lets you monitor 6 pages with 220 checks per month, which is enough to watch your core positions' filing indexes and IR pages and prove the approach before you pay anything. Most investors graduate to a paid plan as their watchlist grows.
| Plan | Price | Pages | Checks / month | Frequency |
|---|---|---|---|---|
| Free | $0 | 6 | 220 | every 60 min |
| Standard | $8/mo or $80/yr | 100 | 15,000 | every 15 min |
| Enterprise | $30/mo or $300/yr | 500 | 100,000 | every 5 min |
| Ultimate | $99/mo or $999/yr | 1,000 | 100,000 | every 2 min |
Annual billing saves two months across every paid tier. Enterprise and Ultimate scale up to 100x if you need thousands of pages or multi-team access.
Standard at $80/year covers 100 pages, enough to monitor filing indexes, IR pages, and news searches across a 25-name portfolio at 15-minute intervals. Catching a single buried disclosure before the market reprices it can pay for years of the subscription. Enterprise at $300/year extends that to 500 pages at 5-minute checks, enough for a fund tracking a full sector plus macro pages like treasury auction and yield data.
Getting Started
Pick your top three holdings. Add a monitor on each company's SEC filing index, its investor relations page, and a news search for its name. Set the AI focus to guidance, risk factors, and management changes, then route alerts to Slack or email. Run it through one earnings cycle and watch how often something material changes before it reaches the headlines.
The research tools in this guide tell you what a company is worth. PageCrawl tells you the moment that answer changes. Start free with 6 monitors and stop finding out three weeks late.