On March 12, 2024, the iShares Bitcoin Trust (IBIT) pulled in nearly $1 billion in net inflows in a single trading day, one of the largest one-day creation events in the fund's short history at the time. The flow was visible on BlackRock's product page within hours of market close, but the first mainstream coverage of the size did not arrive until the next morning. Anyone with a daily monitor on the IBIT Holdings tab saw the change at 6 PM Eastern, hours before the wires.
Most large ETFs publish their full holdings list every business day. iShares, Vanguard, State Street, Invesco, and Schwab all post a downloadable holdings file that updates after market close. The data is free, structured, and machine-readable, but the issuer pages do not push notifications when a new file lands. Reading the same page every evening manually is a chore, and the moments that matter (a new top-10 constituent, a sudden weight shift, a spike in cash drag) are easy to miss inside a 500-line holdings table.
This guide covers how ETF issuers publish daily holdings, what patterns are worth watching for, and how to set up a continuous monitor that surfaces composition changes for any ETF the morning after they land.
Quick Setup
Pick an issuer and a ticker, and we'll show you a sample holdings-diff alert before you ever leave this page.
Why Monitor ETF Holdings Daily
ETF flows and rebalances move underlying stocks in measurable ways. The mechanics are well understood: a constituent addition to a multi-billion-dollar ETF triggers several days of buying from indexers tracking the same benchmark, and a removal does the opposite. For active investors and ETF product teams, holdings deltas are one of the few datasets where you can see flow before it shows up in price.
Index Rebalances Create Predictable Flow
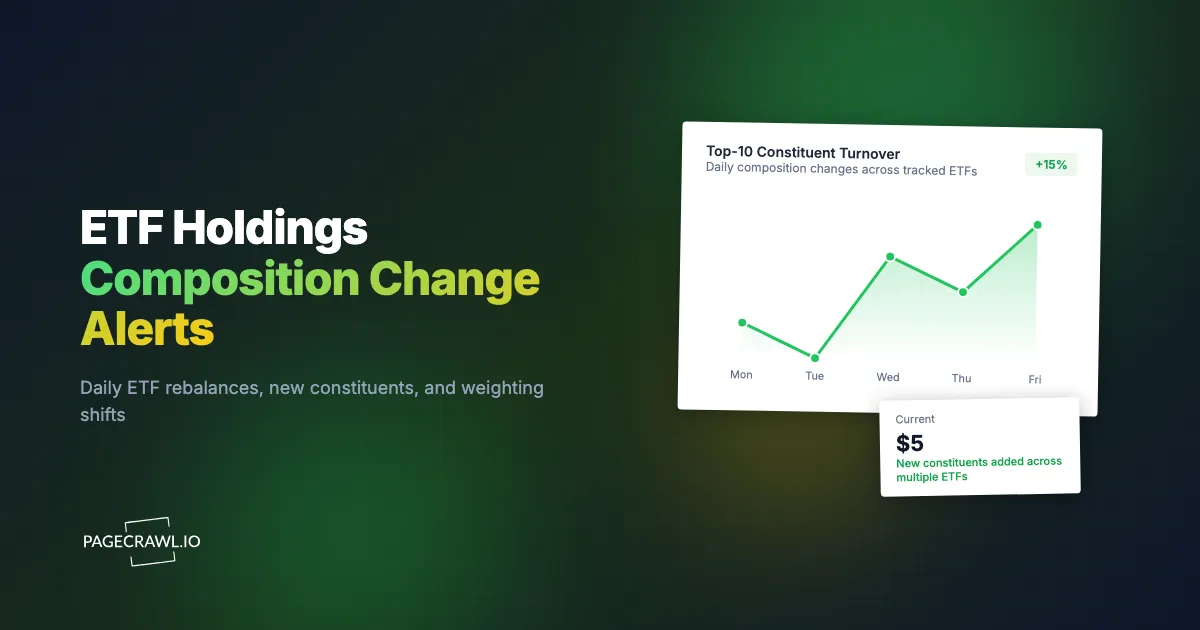
Cap-weighted ETFs adjust quarterly on a published schedule, but smart-beta and active ETFs shift more often, sometimes daily. A new top-10 position in a fund with $5 billion in AUM represents real, mechanical buying in the underlying name. The S&P 500 reconstitution effect is the textbook example, but smaller-cap and thematic funds produce the same dynamic at a more tradable scale.
Sector and Factor Drift Reveals Quiet Positioning
Watching weight shifts at the sector level reveals what passive and rules-based funds are leaning into without waiting for the next prospectus update. A momentum ETF rotating out of healthcare and into industrials over consecutive weeks is a real-money expression of a factor view, visible only if you watch the daily file.
Competitive ETF Intelligence
ETF issuers track each other's strategies closely. A new theme appearing across multiple peer funds in the same week signals a category that may be worth a copycat product. Product managers at large issuers spend real money on competitive intelligence; daily holdings monitoring across peer funds is the cheapest version of the same insight.
Creation and Redemption Signals
Off-calendar weight changes in cap-weighted funds typically reflect creations and redemptions that cleared overnight. A surge in shares outstanding combined with a flat cash position signals fresh demand absorbed into the basket. The reverse signals quiet outflows that may not show up in any news source for days.
How ETF Issuers Publish Holdings
Each issuer maintains a product page per ETF with a Holdings tab that lists every position. The exact URL patterns vary by issuer but are stable per product:
https://www.ishares.com/us/products/{product-id}/{ticker}#tabsAll
https://investor.vanguard.com/investment-products/etfs/profile/{ticker}
https://www.ssga.com/us/en/intermediary/etfs/{ticker}
https://www.invesco.com/us/financial-products/etfs/product-detail?audienceType=Investor&ticker={ticker}
https://www.schwabassetmanagement.com/products/{ticker}
The Holdings tab on each of these pages either embeds the holdings table directly into the page or links to a downloadable CSV that updates daily. Both surfaces are monitorable. iShares is particularly easy because the Holdings table renders inline; Vanguard splits the data across multiple tabs but the per-ticker URL is stable; State Street publishes both an inline view and a daily file.
For most US-listed ETFs, the file updates between 5:30 PM and 7:00 PM Eastern after the close. International ETFs (especially those tracking Asian or European indices) may publish on a different schedule reflecting their primary listing.
Comparing Monitoring Approaches
| Approach | Cost | Latency | Coverage | Best For |
|---|---|---|---|---|
| Manual daily refresh | Free | Same day with effort | Per-fund | One or two flagship funds |
| Bloomberg Terminal | $30K/year | Real-time | Comprehensive | Institutional desks |
| Issuer email alerts | Free | Days to weeks | Marketing only | Awareness, not analysis |
| Third-party ETF data providers (FactSet, Morningstar) | $5K+/year | End of day | Comprehensive | Multi-fund research |
| PageCrawl on issuer pages | Free tier to $80/year | Daily, automated | Any ticker you set up | Active investors and product teams |
The third-party data providers are the right answer if you need a structured panel of 500+ funds, but for an active investor or product team tracking 20-50 funds, the issuer pages plus a monitor are both cheaper and faster. PageCrawl also gives you webhook output that plugs straight into a spreadsheet or notebook.
Setting Up ETF Holdings Monitoring in PageCrawl
Step 1: Find the ETF's product page
Start from the issuer's ETF product directory and search for the ticker. Open the Holdings tab (or the relevant Composition tab on Vanguard and SPDR), and copy the full URL from your browser. Some issuer pages add session parameters; strip those before saving.
Step 2: Add the page to PageCrawl as a content monitor
Paste the URL into PageCrawl. For pages that render the holdings table client-side (most modern issuer sites do), PageCrawl's full-page text capture pulls the table after JavaScript loads. No special configuration is needed.
Step 3: Set a daily check after market close
Most US issuers update holdings between 5:30 PM and 7:00 PM Eastern. A daily check at 6:30 PM catches the new file with minimal noise. For international ETFs, adjust the check time to land 60-90 minutes after the relevant market close.
Step 4: Enable AI summaries
PageCrawl's AI change summaries describe the diff in plain language: "MSFT moved from #4 to #2 weight; new constituent CRWD added at 0.8%." This saves you from opening the issuer page for every alert. For ETF monitoring this is especially valuable because the raw diff against a 500-line CSV is unreadable.
Step 5: Pick a notification channel
Slack and email are the right defaults for ETF monitoring; the data is not minute-sensitive. A #etf-holdings Slack channel that receives the day's diffs across every monitored fund makes morning review trivial. See the Slack alerts setup guide for channel configuration.
Step 6: Group sibling ETFs into folders
Create a folder per category: large-cap growth, momentum, AI thematic, biotech, etc. Drop the monitors for peer funds into the same folder. The folder view shows the day's composition deltas across all peers in one place, which is where cross-fund signals (the same name appearing in three peer funds within a week) actually become visible.
Worked Example: Building a Momentum-Factor Watchlist
Take a typical momentum-factor monitor across the three largest US momentum ETFs: MTUM (iShares), PDP (Invesco), and SPMO (Invesco). The setup looks like this:
- Open each issuer's product page and copy the Holdings tab URL.
- Paste the three URLs into PageCrawl as content monitors.
- Tag all three with
momentum-factor. - Set daily checks at 6:30 PM Eastern.
- Group into a folder named "Momentum ETFs."
- Route alerts to a single
#etf-momentumSlack channel.
Total setup time: about 10 minutes. Total cost: free, well within the Free plan's 6 monitor budget. The first sign of a factor rotation (say, a financials name jumping into the top 10 of two of the three funds in the same week) becomes visible the next morning instead of three months later in the next factor-research note.
Patterns Worth Watching For
New constituents in the top 50. A name appearing in an ETF for the first time often signals an index addition that will be followed by predictable mechanical buying. The bigger the fund, the bigger the flow.
Off-calendar weight changes in cap-weighted funds. These typically reflect creations or redemptions that cleared overnight. A surge in shares outstanding combined with a flat cash position signals fresh demand.
Cash drag changes. A spike in the cash position can signal pending creations not yet fully invested, or the inverse, redemptions paid out of cash before basket sales.
Top-10 turnover. The 10 largest positions in most ETFs are stable from day to day. A new name in the top 10 is unusual and worth attention, especially in funds with multi-billion-dollar AUM.
Same name across peer funds. When the same constituent moves into the top 10 of two or three competing funds in the same week, the signal is much stronger than from any single fund. This is the cross-fund pattern that the folder view in PageCrawl makes obvious.
Combining Holdings Monitoring With Other Signals
The full value of ETF holdings monitoring shows up when you pair it with other public datasets.
Combine with Form 4 insider filings. Pair an ETF holdings monitor with our Form 4 insider trading alerts guide. When insiders are buying a name in the same week it joins a major ETF's top 10, the combined flow picture is much clearer than either signal in isolation.
Combine with 13F institutional holdings. Pair with our 13F holdings change monitor. 13Fs are quarterly and stale, but they tell you who else has been positioning in a name that just joined an ETF basket.
Combine with 10-Q risk-factor diffs. Use our 10-K / 10-Q diff monitor to see whether a newly added constituent is also disclosing new operational risks. The combination is sometimes the earliest read on a thesis change.
Combine with corporate press pages. A name landing in a thematic ETF often comes shortly after a corporate announcement. Add the company's IR press room as a sibling monitor for the names you care about most.
Use Cases
Individual investors. Build a watchlist of three to five ETFs whose composition matters to your portfolio. Pair each with a daily check; the morning summary tells you exactly what changed overnight.
Index-arbitrage traders. Pair an ETF holdings monitor with a price monitor on the constituents. New additions sometimes lag in price; new deletions sometimes overshoot to the downside. The window is short but real.
Factor researchers. Daily snapshots, archived over months, build a clean panel for studying how rules-based funds actually express a stated strategy. PageCrawl's monitoring history doubles as a free factor-data archive.
Competitive ETF product managers. Issuers track each other for theme discovery. PageCrawl gives a product manager at iShares or State Street a same-day view of what is moving in peer funds without manual checking or a Bloomberg seat.
Financial advisors and wealth managers. Track the funds in client portfolios so you can answer "what changed in my ETF last week" questions on the same day. For RIAs with concentrated ETF exposure, this is a real client-experience improvement.
Quantitative strategies. Aggregate ETF flows across a category and use them as an alternative-data factor input. ETF flow is a documented mid-frequency signal in academic research.
Frequently Asked Questions
How often do ETF issuers actually update holdings? Most US-listed ETFs update once per business day after market close. Some active ETFs publish with a one-day lag for proprietary reasons. International ETFs may have different cadences reflecting their primary market.
Can I monitor the downloadable CSV directly? Yes. PageCrawl can monitor any URL that returns text or HTML, including CSV files. For machine-readable workflows, this is often easier than parsing the HTML table. Webhook output gives you the raw delta to feed into a notebook or sheet.
What about active ETFs with delayed disclosure? Some active ETFs disclose holdings only quarterly to protect strategy. For these, monitor the disclosure-publication page; the issuer signals when the file is refreshed even if the lag is intentional.
Will I get noise from intraday navigation changes? Use PageCrawl's full-page text mode, which captures content rather than chrome. The Holdings tab content is stable through the trading day and only changes after the daily file lands.
Do I need a paid plan to monitor ETFs? No. The Free plan supports 6 monitors, which is enough for a focused watchlist. Standard at $80/year supports 100, which covers most asset-allocator and product-team needs.
How does this compare to subscribing to issuer emails? Issuer emails are marketing-driven and lag the actual holdings file by days or weeks. Monitoring the page directly gives same-day awareness.
Choosing your PageCrawl plan
PageCrawl's Free plan lets you monitor 6 pages with 220 checks per month, which is enough to validate the approach on your most critical pages. Most teams graduate to a paid plan once they see the value.
| Plan | Price | Pages | Checks / month | Frequency |
|---|---|---|---|---|
| Free | $0 | 6 | 220 | every 60 min |
| Standard | $8/mo or $80/yr | 100 | 15,000 | every 15 min |
| Enterprise | $30/mo or $300/yr | 500 | 100,000 | every 5 min |
| Ultimate | $99/mo or $999/yr | 1,000 | 100,000 | every 2 min |
Annual billing saves two months across every paid tier. Enterprise and Ultimate scale up to 100x if you need thousands of pages or multi-team access.
In event-driven strategies, minutes matter. One actionable signal surfaced before the broader market reacts can return more than a year of Ultimate. Standard at $80/year covers the core IR, press, and filings pages for a handful of positions. Enterprise at $300/year scales to a full watchlist. All plans include the PageCrawl MCP Server, so you can ask Claude to summarize every material change across a company's IR, press, and filings over any period you care about and get the evidence pulled straight from your monitoring archive. AI assistants can create monitors through conversation on every plan, including Free. Ultimate at $999/year adds 2-minute frequency and web archiving, which matters if you need provable timestamps for a thesis.
Getting Started
Pick three ETFs in a category you care about, copy their issuer Holdings tab URLs, and add them to PageCrawl on a daily check. Create a free account, set email or Slack alerts, and you will see the next composition change the morning after it lands.
Once you see the pattern, expand to a full 15-25 fund watchlist organized by category (large-cap, momentum, sector thematic, international). The Standard plan at $80/year covers a serious watchlist with room for sibling monitors on issuer press rooms and IR pages. For investors and product teams who treat ETF composition as a real input to decisions, the cost recovers itself the first time a same-day signal leads to a positioning trade or a competitive product brief.