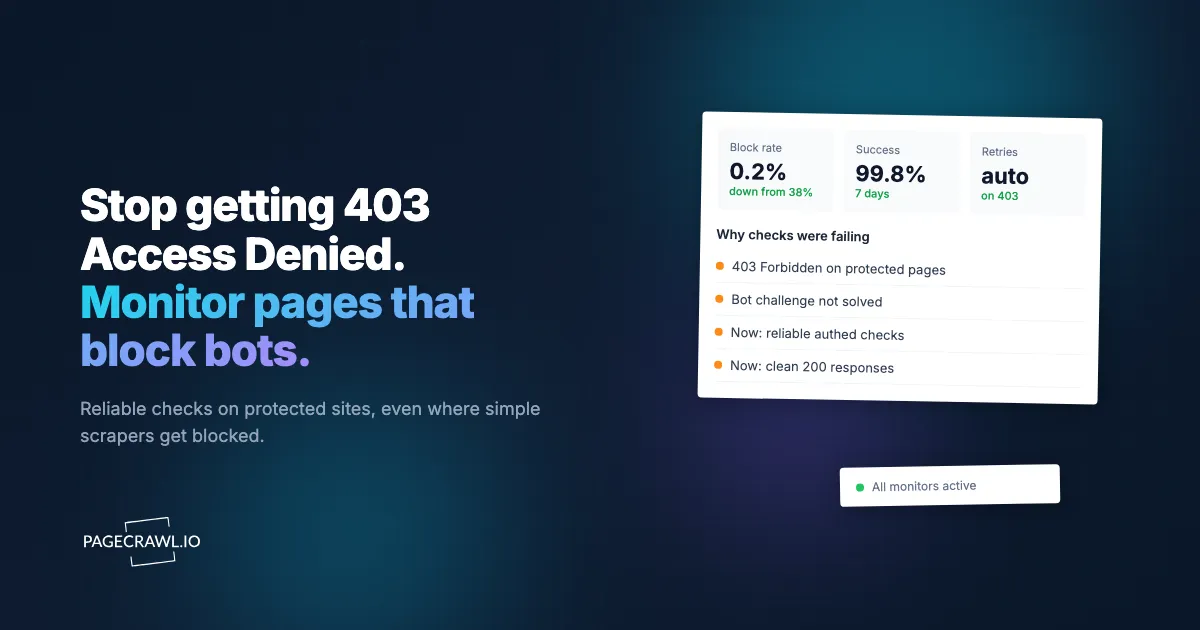
You set up a monitor on a page that loads fine in your browser. The first check comes back empty, or worse, with a wall of text that reads "403 Forbidden" or "Access Denied." You refresh the page yourself and it works. So why is the monitor blocked?
A 403 status code means the server received your request, understood it, and refused to fulfill it. Unlike a 404 (the page does not exist) or a 500 (the server broke), a 403 is deliberate. Something about the request looked wrong to the server, so it slammed the door. The page is there. You just are not allowed to see it the way you asked.
This is one of the most common problems people hit when they start monitoring websites for changes, and it has half a dozen distinct causes that all surface as the same status code. This guide walks through each cause, how to tell which one you are dealing with, the fixes you can apply yourself, and where a managed monitoring service quietly handles the problem so you never see the 403 at all.
What does a 403 error actually mean?
A 403 Forbidden is the server saying "I know who you are (or I do not need to), and the answer is no." It is different from a 401 Unauthorized, which specifically means "you need to authenticate." Both are defined in the HTTP specification, RFC 9110. In practice the line blurs, and many sites return 403 for situations that are really authentication or rate-limiting problems.
When you debug a 403, the first useful move is to look at the actual response body and headers, not just the status code. Many servers include a hint:
curl -s -i -o /dev/null -w "%{http_code}\n" https://example.com/page
# 403

curl -s -i https://example.com/page | head -40
# Look for Server:, Retry-After:, CF-Ray:, X-Cache:, or a message
# like "Request blocked" or "Rate limit exceeded" in the body
The body and headers usually tell you which of the causes below you are hitting. A Retry-After header points at rate limiting. A login form in the HTML points at authentication. A short generic block page with no detail points at request fingerprinting. Read what the server gives you before you start guessing.
Cause 1: Rate Limiting
The most frequent reason a monitor gets a 403 is that it asked too often. Sites track requests per IP address over a window of time. When you check a page every minute, that is 1,440 requests a day from one address. A site that expects a human visiting a few times a day sees that volume and throttles you.
Rate limiting can return a few different status codes. The clean implementation returns 429 (Too Many Requests) with a Retry-After header. The blunt implementation just returns 403 once you cross a threshold. Either way, the fix is the same.
How to tell
The page works on the first check after you wait a while, then starts failing once you increase frequency. The block clears on its own after some minutes or hours. You may see a Retry-After header or a body that mentions "rate" or "too many requests."
Fixes
- Lower your check frequency. If you are checking every 5 minutes and the content changes daily, drop to once or twice a day. Most monitoring needs do not require minute-level frequency. Match the frequency to how often the content actually changes.
- Spread checks across pages. If you monitor 30 pages on one domain, do not check them all in the same minute. Stagger them. In PageCrawl, Crawl Politeness does this for you: set a minimum delay per domain and your checks to that site start one after another instead of all at once.
- Respect
Retry-After. If the server tells you when to come back, come back then, not sooner.
This is the one cause you have the most direct control over. Before reaching for anything more complicated, slow down.
Cause 2: Geographic Blocking
Some sites only serve visitors from certain countries. Streaming catalogs, regional retailers, government portals, and news sites with licensing restrictions all do this. If your monitoring runs from a data center in a region the site does not serve, you get a 403 or a redirect to a "not available in your country" page.
How to tell
The page loads fine for you at home but fails from the monitor. If you connect through a VPN or a free web proxy set to a different country and the page suddenly fails (or starts working), geography is the variable. The block is consistent, not intermittent, which separates it from rate limiting.
Fixes
- Check from a location the site serves. You need the request to originate from an allowed region, which is what residential proxies for geo-restricted and IP-blocked pages provide. With self-hosted tooling this means routing through an exit point in the right country. With a managed service this is a proxy location setting rather than infrastructure you build.
- Find a regional mirror or API. Some sites publish the same data through a country-neutral API or a separate subdomain that is not geo-fenced.
Geographic blocking is a property of where the request comes from, not how it is made, so no amount of header tweaking fixes it. You have to change the origin.
Cause 3: Missing or Suspicious Request Headers
Browsers send a rich set of headers with every request: a User-Agent identifying the browser and OS, an Accept header listing content types, Accept-Language, Referer, and more. A bare HTTP request from a script sends almost none of these, or sends an obviously non-browser User-Agent like python-requests/2.31. Some servers reject anything that does not look like a real browser.
How to tell
A plain curl or script request returns 403, but the same URL loads in your browser. Adding browser-like headers makes the request succeed.
Fixes
Send headers that match what a browser sends. At minimum, a realistic User-Agent:
curl -s -i 'https://example.com/page' \
  -H 'User-Agent: Mozilla/5.0 (Windows NT 10.0; Win64; x64) AppleWebKit/537.36 (KHTML, like Gecko) Chrome/126.0 Safari/537.36' \
  -H 'Accept: text/html,application/xhtml+xml,application/xml;q=0.9,*/*;q=0.8' \
  -H 'Accept-Language: en-US,en;q=0.9'
In Python with requests:
import requests

headers = {
    "User-Agent": (
        "Mozilla/5.0 (Macintosh; Intel Mac OS X 10_15_7) "
        "AppleWebKit/537.36 (KHTML, like Gecko) Chrome/126.0 Safari/537.36"
    ),
    "Accept": "text/html,application/xhtml+xml,application/xml;q=0.9,*/*;q=0.8",
    "Accept-Language": "en-US,en;q=0.9",
}

resp = requests.get("https://example.com/page", headers=headers, timeout=20)
print(resp.status_code)
Some sites also require a Referer header (the page you supposedly came from) or a specific cookie set on a prior request. If headers alone do not work, the site is probably checking whether JavaScript executes, which moves you into the next cause.
Cause 4: JavaScript and Browser Checks
A growing number of sites do not just inspect headers. They serve a page that runs JavaScript to verify the visitor is a real browser before showing the real content. A simple HTTP request never runs that JavaScript, so it only ever sees the challenge page, which the server returns with a 403 or a holding status.
How to tell
The raw HTML you fetch is short, contains no real content, and includes script tags or a message about verifying your browser. The page works perfectly in a real browser because the browser runs the check and passes.
Fixes
- Use a tool with a real browser engine. HTTP-only monitoring (a script that fetches HTML) cannot pass these checks. You need monitoring that renders the page in an actual browser, executes the JavaScript, and reads the result. This is the same requirement that comes up when you monitor websites behind a login form, since both involve running real browser logic before reading content.
- Look for an underlying API. Sometimes the content rendered by JavaScript comes from a JSON endpoint you can monitor directly. If the data is available as JSON, monitoring the API is faster and far less fragile than rendering the page. See our guide on monitoring a JSON API field with JSONPath or jq filters for that approach.
This is the cause that pushes most people from a quick script to a proper monitoring tool. Building and maintaining browser automation that reliably passes these checks is a real engineering project, not a weekend script. The trade-offs here are the same ones covered in web scraping versus web monitoring: scraping infrastructure is something you maintain, monitoring is something you configure.
Cause 5: Authentication Required
Sometimes a 403 (or its cousin the 401) simply means the content lives behind a login and your request is not authenticated. Vendor portals, partner dashboards, internal tools, and gated documentation all behave this way. The page works for you because your browser holds a session cookie. The monitor has no session, so it gets refused.
How to tell
The URL works when you are logged in and redirects to a login page (or returns 403) when you are not. Open the page in a private browsing window where you have no session; if it fails the same way the monitor does, authentication is the issue.
Fixes
You need the monitor to log in before it reads the page. That means a tool that can run an automated login sequence: navigate to the login page, fill the credentials, submit, wait for the redirect, then check the target page. We cover this end to end in how to monitor password-protected websites, including HTTP Basic Auth, multi-step logins, and how to handle two-factor flows.
Note: always use a dedicated, read-only monitoring account rather than your personal admin credentials, and review the site's terms of service before automating access.
Cause 6: IP or Network Reputation
Servers sometimes block entire ranges of IP addresses associated with data centers, known scrapers, or abusive traffic. If your monitoring runs from a cloud provider whose address range has a poor reputation, you can get a 403 before the server even looks at your request details.
How to tell
Header tweaks and frequency reductions make no difference. The block is immediate and total. The same request from a residential connection (your home network) works fine. This is the hardest cause to diagnose because it looks like everything else.
Fixes
For personal monitoring, try PageCrawl Relay if the public page works through your own connection. There is no additional fee on any plan, including Free. Keep a computer online and supply the bandwidth; normal monitor and check limits apply. Relay does not reuse your browser login, so authenticated pages still need a login configured in PageCrawl.
For business monitoring, we recommend Enterprise or Ultimate and their included managed connection options, which do not depend on your own computer staying online. Web Unblocker is a separate paid option. Check the captured content before relying on a different connection for more monitors.
A Quick Diagnostic Table
Use the response details to narrow down which cause you are facing before you start applying fixes.
| Symptom | Likely cause | First fix to try |
|---|---|---|
Works at low frequency, fails when frequent; Retry-After header |
Rate limiting | Lower check frequency |
| Consistent block, clears via VPN to another country | Geographic blocking | Run checks from an allowed region |
| Fails as a script, works in a browser; fixed by adding headers | Missing headers | Send a realistic User-Agent and Accept |
| Raw HTML is a short challenge page with scripts | JavaScript / browser check | Use a real browser engine |
| Redirects to login or works only when signed in | Authentication required | Add an automated login sequence |
| Immediate block, header and frequency changes do nothing | IP reputation | Change request origin / use managed service |
When should you stop debugging and use a managed service?
You can solve all of these yourself. The question is whether you want to. Lowering frequency is free and quick. Adding headers takes minutes. But once you hit JavaScript browser checks and IP reputation problems, the fix is no longer a code change. It is infrastructure: a fleet of real browsers, a pool of trustworthy request origins, and the ongoing maintenance to keep both working as sites change their defenses.

This is the dividing line between a script and a service. A managed monitoring tool absorbs causes 3 through 6 as configuration rather than code. PageCrawl renders every page in a real browser engine you can select per monitor, so JavaScript browser checks pass the same way they do for a human visitor. Request origination is handled for you, which covers geographic and reputation blocks without you provisioning anything. Login sequences are built in for authenticated pages. You configure what to watch and how often, and the 403 problem largely disappears.
That does not make managed monitoring magic. A site that geo-blocks a region you genuinely cannot reach, or one whose terms of service prohibit automated access, is still off limits. But the everyday 403s that stall a DIY setup are exactly what a hosted service is built to handle.
PageCrawl also ships with sensible defaults that head off the most common causes. Screenshots are on so you can verify the monitor actually sees the real page and not a block screen. Cookie and overlay dismissal runs automatically, which clears the consent banners that sometimes wedge a page into a 403-like state. If you are monitoring APIs rather than pages, our guides on monitoring REST APIs for breaking changes and the broader API monitoring guide cover the JSON-first path that sidesteps browser checks entirely.
How do you verify the fix worked?
Whatever fix you apply, confirm the monitor is reading real content and not a polished error page. A 403 block page can have a 200 status if the site serves the block as a normal page, so do not trust the status code alone.
- Check the captured screenshot. Does it show the actual content or a "verify you are human" screen?
- Inspect the captured text. Search it for the words "forbidden," "denied," "blocked," or "rate." If they appear, the monitor is recording the block, not the page.
- Compare against a manual visit. Load the page yourself in a private window and confirm the monitor's snapshot matches what you see.
Once the snapshot matches the real page, set up your change alerts. For the alerting side, see setting up email alerts for website changes or Slack alerts for website changes.
Choosing your PageCrawl plan
PageCrawl's Free plan lets you monitor 6 pages with 220 checks per month, which is enough to validate the approach on your most critical pages. Most teams graduate to a paid plan once they see the value.
| Plan | Price | Pages | Checks / month | Frequency |
|---|---|---|---|---|
| Free | $0 | 6 | 220 | every 60 min |
| Standard | $8/mo or $80/yr | 100 | 15,000 | every 15 min |
| Enterprise | $30/mo or $300/yr | 500 | 100,000 | every 5 min |
| Ultimate | $99/mo or $999/yr | 1,000 | 100,000 | every 2 min |
Annual billing saves two months across every paid tier. Enterprise and Ultimate scale up to 100x if you need thousands of pages or multi-team access.
At an engineering hourly rate, Standard at $80/year pays for itself the first time you catch a breaking API change, a deprecated endpoint, or a silent config change before it takes down production. 100 monitored pages is enough to cover the changelogs and docs of every third-party API your stack depends on. Enterprise at $300/year adds 5-minute checks and 500 pages. All plans include the PageCrawl MCP Server, which plugs directly into Claude, Cursor, and other MCP-compatible tools. Developers can ask "what changed in the Stripe API docs this month?" and get a summary pulled from your own monitoring history. AI assistants can create monitors through conversation on every plan, including Free, turning your tracked pages into a living knowledge base instead of a pile of alert emails.
Getting Started
Start with the cheapest possible explanation. Before you build anything, lower your check frequency and look at the actual response body and headers, because rate limiting and missing headers account for most 403s and both are quick fixes. Pick one or two pages that are currently returning 403, apply the matching fix from the diagnostic table above, and verify with a screenshot that the monitor sees real content.
If the page survives a JavaScript browser check or sits behind a login, that is the point to let a managed tool carry the infrastructure rather than maintaining it yourself. PageCrawl's free tier covers 6 pages with 220 checks a month, which is enough to confirm a stubborn 403 page loads cleanly before you commit to anything. Once you see your blocked pages reading correctly, expand to the rest of the pages you care about.