You need to know when a web page changes. Maybe it is a competitor's pricing page, a regulatory document, a product listing page, or a documentation site your application depends on. The question is whether you build the monitoring infrastructure yourself or use an API that handles it for you.
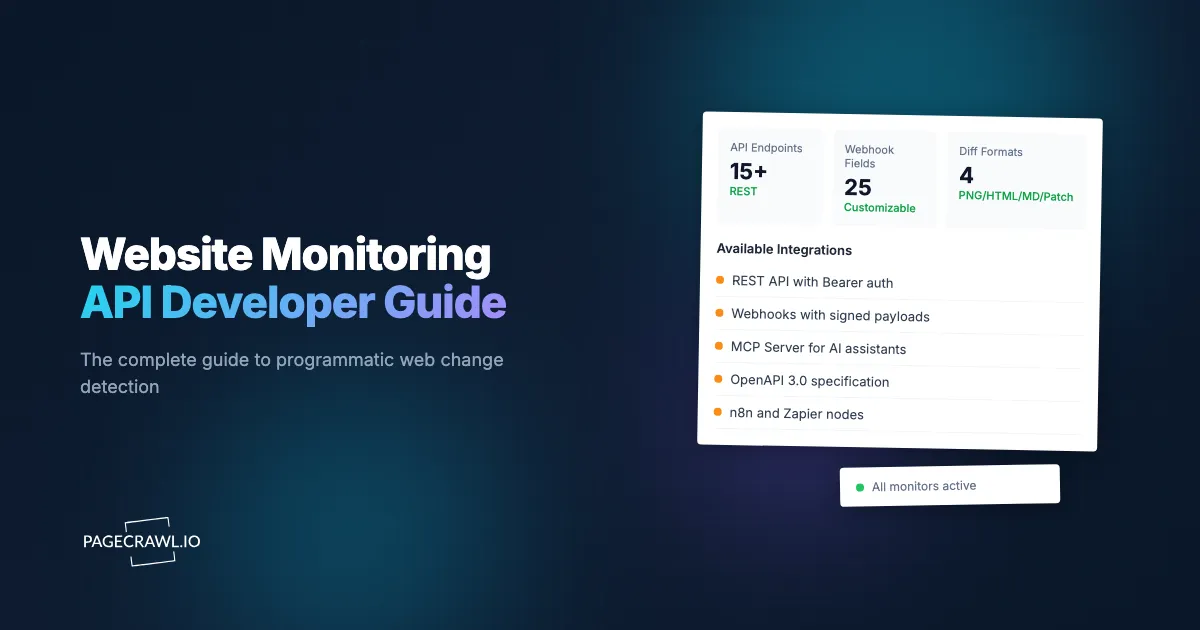
This guide covers what a developer needs to know about website change monitoring APIs: where the reference lives, how to authenticate, how to create monitors and webhooks, how developer mode turns the dashboard into a source of ready-made API calls, and how to build automated workflows on top of change detection.
What does a website change monitoring API do?
A website change monitoring API handles four things you would otherwise build yourself:
- Scheduled fetching - Opens pages on a configurable schedule using a real browser (handling JavaScript rendering and dynamic content)
- Change detection - Compares each fetch with the previous one, identifying what specifically changed
- Diff generation - Produces structured diffs in multiple formats (text, HTML, markdown, visual screenshots)
- Event delivery - Sends webhooks, emails, or push notifications when changes are detected
Without a monitoring API, you are writing cron jobs, managing headless browsers, storing snapshots, building comparison logic, and wiring up notifications. That is a substantial engineering investment for what should be a utility.
Where is the API documented?
The full PageCrawl API reference lives at pagecrawl.io/developers. It is generated from PageCrawl's OpenAPI specification, which lists the endpoints, parameters, enums and response schemas. The spec itself is downloadable from the same page, so you can import it into Postman, generate a typed client, or hand it to an AI coding assistant. Coding agents can also load PageCrawl's pagecrawl-api skill, which points them at this specification and teaches the common integration patterns, including webhook signature verification.
The reference is organised by what you are trying to do rather than by controller:
| Section of the reference | What it covers |
|---|---|
| Quickstart | The one-line track-simple call and the ai_page_focus hint |
| Pages | Create, list, update and delete monitors, read check history |
| Diffs and screenshots | Text diffs as HTML, Markdown or PNG, screenshots and visual diffs per check |
| Review boards | Move pages between review lanes in bulk |
| Data Sources | Push values in with a secret ingest URL instead of fetching a page |
| Reference Implementations | Copy-paste polling, webhook verification and hybrid examples in Python, Node.js and PHP |
Everything else in this guide links back to the relevant operation in that reference, which has the full detail for each field.
How do you authenticate?
Every request needs an API token, passed as a Bearer header. Tokens are created under Settings > API access in the dashboard, where you can name each one, set an expiry, and revoke it later without touching the others.
curl "https://pagecrawl.io/api/pages" \
  -H "Authorization: Bearer YOUR_TOKEN"
Three details worth knowing before you write a client:
- Workspaces. If your account has more than one workspace, pass
workspace_idas a query parameter. Without it, calls run against the workspace the token's user last had open. - Rate limits. Limits apply per endpoint and per account, and depend on your plan. Over a limit you get HTTP 429 with a
Retry-Afterheader, so wait that many seconds rather than retry in a tight loop. - Errors. API errors are JSON with a
messagefield, and a failed validation returns HTTP 422 with a per-fielderrorsmap. A new monitor returns 201 with the page object, an update returns 200. If you are over your active page limit, the monitor is still saved, but paused.
Note: a query-string api_token parameter is also accepted for quick tests in a browser, but keep it out of scripts and logs. Bearer headers are the supported form.
Setting Up Your First Monitor
Most monitoring APIs follow a similar pattern. Here is how it works with PageCrawl's REST API:

1. Create a monitor with the Quick track a page endpoint:
curl -X POST "https://pagecrawl.io/api/track-simple" \
  -H "Authorization: Bearer YOUR_TOKEN" \
  -H "Content-Type: application/json" \
  -d '{
    "url": "https://www.notion.com/pricing",
    "tracking_mode": "fullpage",
    "frequency": 60,
    "ai_page_focus": "Plan prices and limits. Ignore testimonials and footer copy."
  }'
With only a URL, track-simple checks the page daily, alerts by email, removes cookie banners and overlays before each capture and picks a location automatically. It accepts the common options (frequency, tracking mode, folder, tags, notification channels, custom rules, location) as you grow into them. When you need several tracked elements on one page, saved logins or templates, switch to Create a new page, which takes the full configuration object.
2. Set up a webhook. Webhooks are created under Settings > Integrations > Webhooks or with a single call:
curl -X POST "https://pagecrawl.io/api/hooks" \
  -H "Authorization: Bearer YOUR_TOKEN" \
  -H "Content-Type: application/json" \
  -d '{
    "target_url": "https://your-app.com/webhooks/page-change",
    "match_type": "all",
    "events": ["change_detected"],
    "payload_fields": ["id", "title", "status", "changed_at", "ai_summary",
                       "ai_priority_score", "markdown_difference", "page",
                       "previous_check"]
  }'
match_type decides which monitors feed the hook: all, specific monitors, tags, folders, or every monitor on a set of websites. events lets one hook receive detected changes, errors, or both, and payload_fields trims the JSON body to the fields you actually store (with previous_check trimmed to the same fields). Leave payload_fields out to receive every field. The response includes the signing_secret you use to verify deliveries. The webhook integration article lists every field, explains which checks are delivered, and shows how to send a test delivery.
3. Process incoming changes. A delivery is sent for every change PageCrawl saves, including a monitor's first capture and changes that sent no alert, so skip what you do not want to act on:
@app.route("/webhooks/page-change", methods=["POST"])
def handle_change():
    data = request.json
    if data.get("status") != "ok" or data.get("previous_check") is None:
        return "", 200  # a failed check, or a monitor's first capture

    print(f"Page changed: {data['title']}")
    print(f"AI summary: {data.get('ai_summary')}")
    print(f"Diff: {data.get('markdown_difference')}")

    # Your application logic here
    return "", 200
That is the entire setup. The API handles scheduling, browser rendering, comparison, and delivery. Return a 2xx quickly and do the heavy work asynchronously, since a slow endpoint counts as a failed delivery.
What does developer mode do?
Developer mode is a switch under Settings > API access that exposes the IDs and API calls behind every screen in the dashboard, so you can configure a monitor by hand and copy the exact request that reproduces it. It changes nothing about how monitors run. It only changes what the interface shows you.
With developer mode on:
- Page IDs appear in the tracked pages list, and each monitor's ID is shown on its detail page. Folder names carry their folder ID as well.
- Check IDs appear on every row of the change history, so a diff you are looking at can be fetched programmatically without guessing which check it was.
- Every ID is a menu of API endpoints. Click a page ID and you get copyable URLs for the page details, check history, statistics, the latest text diff in HTML, Markdown and PNG, the latest screenshot and visual diff, time travel lookups, and a "trigger a check now" call. Click a check ID and you get the same diff and screenshot endpoints pinned to that specific check. Each entry copies the URL, opens it in a new tab (the API accepts your browser session, so the response renders in place), or copies a ready-to-run curl command with the token placeholder filled in.
- The create and edit screens show the API call that builds the monitor. A collapsed panel at the bottom of the form reads "Developer mode: see the API call that builds this monitor". Expand it and you get a curl
POST /api/pages(orPUT /api/pages/{id}while editing) whose body is the exact payload the form is about to submit, including the parts with no obvious API spelling such as tracked elements, alert rules, page actions and the chosen location.
The intended workflow is: build one monitor in the interface until the preview captures the right thing, expand the panel, copy the curl, and generalise it in your script. The API reference then documents every field you copied. This is faster than reading the schema first, and it guarantees the API-created monitors behave the same as the one you tested by hand.
Which tracking mode should you use?
Default to fullpage and switch only when the content type demands it: price for product pages, content_only for editorial, feed for repeating listings, specific_text when one element is all that matters. A pricing page needs different handling than a terms of service document or an RSS feed.
| Mode | Best for | What it tracks |
|---|---|---|
fullpage |
General pages, ToS, policies | All visible text |
content_only |
News, blogs, articles | Main content (strips navigation and sidebars) |
reader |
Editorial content | Reader-mode extracted text |
price |
E-commerce, product pages | Auto-detected prices and availability |
specific_text |
Any page | Text of a specific CSS/XPath element |
specific_number |
Dashboards, stats | Numeric value from a specific element |
feed |
Job boards, listings | Repeating items (new items alert; removed or edited items once you turn those alerts on) |
seo |
Marketing, SEO | Title, meta, canonical, robots, OG tags |
For most use cases, fullpage is the right default. Use price for e-commerce pages, content_only for editorial content, and specific_text when you only care about one element on the page. The full catalogue, including file and document types, is listed under available tracked element types, and the tracking_mode enum in the reference is the authoritative list of what the API accepts.
Webhook Payload Structure
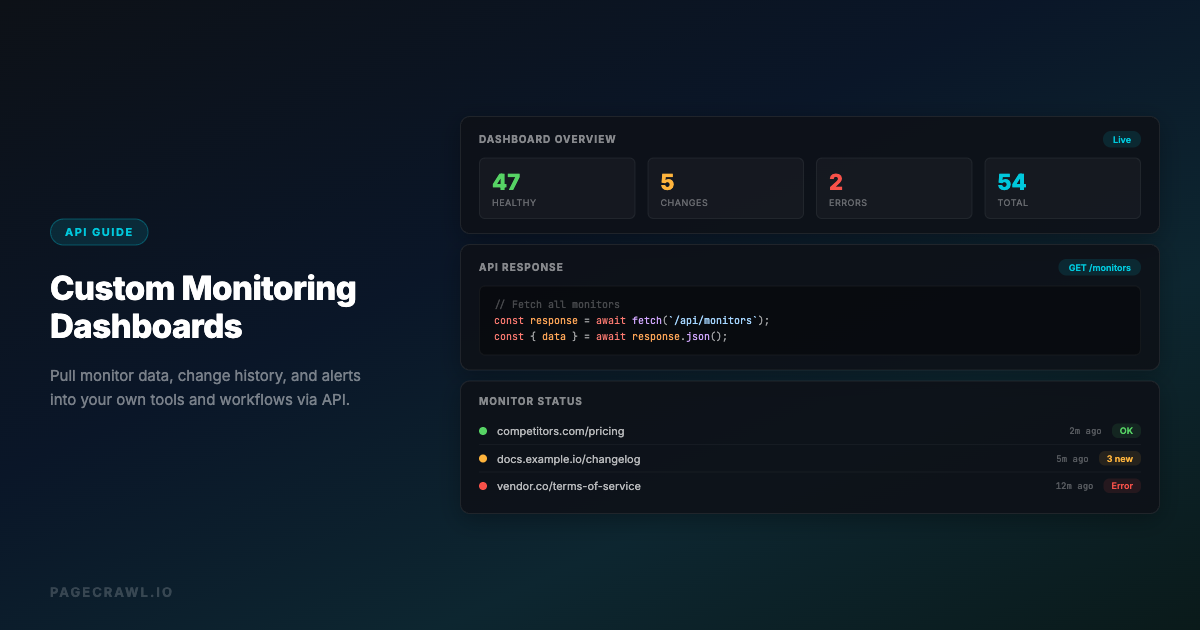
When PageCrawl saves a change, the webhook delivers a JSON payload with structured data about it. You choose which fields are included with payload_fields when creating the hook.
{
  "id": 12345,
  "title": "Competitor Pricing Page",
  "status": "ok",
  "changed_at": "2026-05-04T14:30:00.000000Z",
  "contents": "Pro plan: $59/month...",
  "difference": 8,
  "human_difference": "The value has increased by 8% from the last check (3rd May)",
  "ai_summary": "The Pro plan price increased from $49/mo to $59/mo. The Enterprise plan now includes SSO.",
  "ai_priority_score": "85.00",
  "markdown_difference": "- Pro plan: $49/month\n+ Pro plan: $59/month",
  "page": {
    "id": 100,
    "name": "Competitor Pricing Page",
    "url": "https://{competitor-domain}/pricing",
    "slug": "competitor-pricing"
  }
}
Key fields for developers:
markdown_difference- Machine-parseable diff showing additions and removalsai_summary- Natural language summary of what changed (while AI summaries are on)ai_priority_score- 0-100 importance score as a decimal string (higher = more significant change);nullfor a monitor's first capture, for changes where only a price, number, stock or availability value moved, and while AI analysis is offcontents- Current value of the main tracked elementpage_elements- One entry per tracked element when a monitor tracks several, each with its own value and difference (previous_check.page_elementsholds the earlier values)page_screenshot_image- Signed URL to a full-page screenshotevent_type-change_detectedorerror, useful when one hook receives both (sent unless you trimpayload_fieldswithout it)previous_check- the previous check's values,nullon a monitor's first capture
Every delivery is signed so your endpoint can verify it came from PageCrawl. The reference implementations have verification code in Python, Node.js and PHP, checked against the raw request body.
What diff formats can you pull from the API?
Every detected change is available as a PNG image, rendered HTML, markdown, or a unified patch, so you can embed it in a report, render it in your own UI, feed it to a model, or apply it as a patch. Beyond webhooks, you can retrieve diffs on demand in multiple formats:
| Format | Endpoint | Use case |
|---|---|---|
| PNG image | GET /api/pages/{id}/checks/{checkId}/diff.png |
Embed in reports, emails |
| HTML | GET /api/pages/{id}/checks/{checkId}/diff.html |
Render in web UI |
| Markdown | GET /api/pages/{id}/checks/{checkId}/diff.markdown |
Feed to LLMs, log in text |
| Patch | GET /api/pages/{id}/checks/{checkId}/diff.patch |
Apply as unified diff |
| Screenshot | GET /api/pages/{id}/checks/{checkId}/screenshot |
Archive what the page looked like |
| Visual diff | GET /api/pages/{id}/checks/{checkId}/diff |
Highlight pixel-level changes |
The literal latest works in place of a check ID, so GET /api/pages/{id}/checks/latest/diff.markdown always returns the newest change without a prior call to the history endpoint. These are the same URLs developer mode offers from the page and check ID menus, which is the quickest way to find the right one for a diff you are already looking at.
Notification Rules
Not every change deserves an alert. Alert conditions decide which changes send alerts (email, chat and phone). On track-simple, each rule applies to the monitor's first tracked element, and value is always a string:
{
  "rules_enabled": true,
  "rules": [
    {"type": "contains", "value": "price"},
    {"type": "text_difference", "value": "5"}
  ],
  "rules_and": false
}
By default, a change that does not meet the conditions is not saved either, so it never reaches a webhook. With Always record change detections on (under Conditions & Filters in the app), every change is saved and delivered to webhooks, and the conditions decide only the alerts, so filter in your receiver as well. Ignore rules work earlier, before comparison, so a difference they remove is never saved or delivered.
Rule types fall into a few families:
- Text:
contains,ncontains,added,removed,added_or_removed,text_difference(percentage changed) - Numeric:
eq,neq,gt,lt,gte,lte,increased,decreased,increased_decreased, plus_valuevariants that compare the absolute change rather than the percentage - Feeds:
feed_added,feed_removed,feed_changed,feed_order,feed_price_changed - Noise control:
ignore_text,ignore_digitsandignore_datesdrop matching fragments before comparison
rules_and decides whether every rule must match or any one of them. See the full API reference for the request schema, and notification conditions and filters for the equivalent controls in the dashboard.
Common Integration Patterns
Database logging
Store every saved change in your own database for historical analysis:
@app.route("/webhooks/page-change", methods=["POST"])
def log_change():
    data = request.json
    if data.get("status") != "ok":
        return "", 200  # a failed check repeats the last saved change
    db.execute(
        "INSERT INTO page_changes (monitor_id, url, changed_at, summary, diff, priority) VALUES (?, ?, ?, ?, ?, ?)",
        [data['page']['id'], data['page']['url'], data['changed_at'],
         data.get('ai_summary'), data.get('markdown_difference'),
         data.get('ai_priority_score')]
    )
    return "", 200
Slack alerting with priority filtering
Only send high-priority changes to Slack:
@app.route("/webhooks/page-change", methods=["POST"])
def alert_slack():
    data = request.json
    if data.get("status") != "ok" or data.get("previous_check") is None:
        return "", 200  # a failed check, or a monitor's first capture

    score = data.get("ai_priority_score")  # a decimal string such as "72.00", or None
    if score is not None and float(score) < 50:
        return "", 200  # Skip low-priority noise

    label = f"{float(score):.0f}/100" if score is not None else "not scored"
    requests.post(SLACK_WEBHOOK, json={
        "text": f"*{data['title']}* changed (priority: {label})\n{data.get('ai_summary') or 'No summary'}"
    })
    return "", 200
Price, number, stock and availability changes carry no AI score, so this handler passes them through instead of dropping them.
Trigger CI/CD on documentation changes
Re-deploy when your documentation source changes, using a repository dispatch event from the GitHub REST API:
@app.route("/webhooks/page-change", methods=["POST"])
def trigger_rebuild():
    data = request.json
    # Trigger GitHub Actions workflow
    requests.post(
        f"https://api.github.com/repos/{REPO}/dispatches",
        headers={"Authorization": f"token {GITHUB_TOKEN}"},
        json={"event_type": "docs-changed", "client_payload": {"url": data['page']['url']}}
    )
    return "", 200
Push values that are not on a web page
Not everything you want to track is a page. A metric from an internal job, a count from a CLI, or a value scraped by your own script can be pushed into a data source and gets the same history, charts, rules and webhooks as a monitored page:
curl -d value=42 https://pagecrawl.io/api/ingest/YOUR_INGEST_TOKENThe ingest URL is a secret, so this call needs no Authorization header, which makes it easy to drop into a cron job or a CI step. Anyone holding it can also read the values back, so keep it out of client-side code.
How do you monitor pages that only load from your own network?
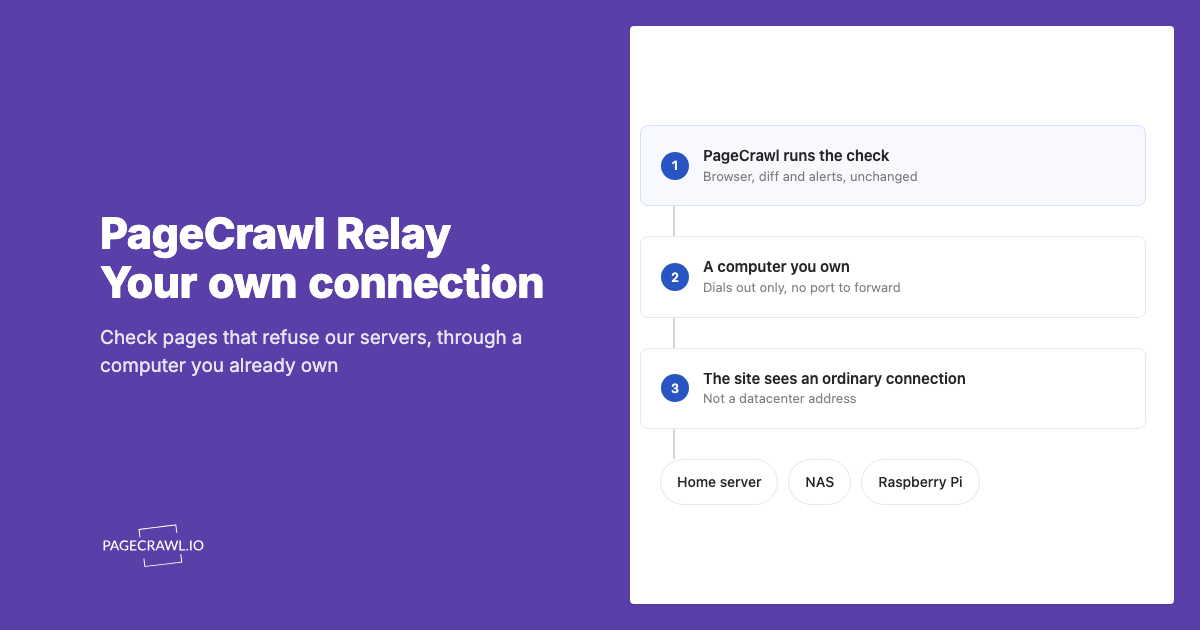
Some public pages open fine from your home or office connection but answer a monitoring service with a block page, an empty template, or a different regional version. PageCrawl Relay solves this by letting PageCrawl fetch those pages through a small open-source client running on a machine you control, while the scheduling, comparison, history, AI summaries and webhooks stay in PageCrawl.
The client makes an outbound connection to PageCrawl and keeps it open, so there is no port forwarding, no public proxy endpoint, and no static IP requirement. It refuses to reach private and local addresses, and you can revoke a machine from the dashboard at any time. A Raspberry Pi, NAS, Home Assistant box or any always-on Linux machine will do; the low-cost setup tutorial walks through installing it as a service.
From the API side, a relay is just another location. Enrol the machine under Settings > More > Relays, then pass its location value when creating or updating a monitor:
curl -X POST "https://pagecrawl.io/api/track-simple" \
  -H "Authorization: Bearer YOUR_TOKEN" \
  -H "Content-Type: application/json" \
  -d '{
    "url": "https://www.allbirds.com/products/mens-tree-dashers",
    "tracking_mode": "price",
    "location": "relay:any"
  }'
relay:any uses whichever of your machines is reachable. To pin a monitor to one machine, pick it in the Location dropdown with developer mode on and copy its exact relay: value from the API panel. When no machine is online, the account-level fallback policy under the Relays settings decides whether the check runs from PageCrawl's own locations, waits for the machine to return, or waits and marks the monitor as failed so your error webhook fires.
Relay carries no PageCrawl fee on any plan. It is aimed at personal monitoring and at keeping proxy bandwidth costs down; teams that need managed connections without depending on their own hardware are better served by the Enterprise and Ultimate plans. The Relay announcement post covers the trade-offs in more depth.
MCP Server for AI Assistants
If you use Claude, ChatGPT, or Cursor, the PageCrawl MCP server, which implements the open Model Context Protocol, lets AI assistants manage monitors through conversation:
- "Monitor docs.stripe.com/api and alert me when the API reference changes"
- "What changed across all my monitors today?"
- "Show me the diff for the last change on the pricing page"
This is particularly useful for developers who want to set up API and documentation change monitoring without leaving their IDE. Most of what an assistant sets up can also be done with the REST API described in this guide.
Getting Started
- Create an API token under Settings > API access and switch on developer mode on the same screen.
- Build one monitor in the dashboard, expand the "see the API call" panel, and copy the curl.
- Create a webhook pointing at your endpoint, then use the test delivery to check your handler.
- Open the interactive API reference for the full schema of every field you copied.
The API quick-start article has the same steps with Python and Node.js examples. PageCrawl was built with developers in mind from day one, with a full REST API, customizable webhooks, an MCP server for AI assistants, and a downloadable OpenAPI spec. The REST API, webhooks and Relay are available on every plan, so you can build and test your integration before committing to anything.