The PageCrawl web interface works well for managing monitors and reviewing changes. But teams that monitor dozens or hundreds of pages often need monitoring data in other places: internal dashboards, Slack bots, reporting tools, or custom applications.
The PageCrawl API gives you programmatic access to your monitors, their check history, detected changes, and configuration. You can pull this data into any tool that can make HTTP requests, from a simple Python script to a full React dashboard. If you are setting up monitors for API change detection, a custom dashboard helps your team stay on top of changes across all your dependencies.
This guide covers how to use the PageCrawl API to build custom monitoring dashboards and integrations, with practical examples you can adapt to your own needs.
What You Can Do with the API
The PageCrawl API provides access to:
- List monitors: Get all your monitors with their current status, last check time, and configuration
- Monitor details: Retrieve detailed information about a specific monitor including its settings and tracked elements
- Check history: Pull the history of checks for a monitor, including detected changes
- Change diffs: Get the actual text differences detected between checks
- Trigger checks: Programmatically trigger an immediate check on any monitor
- Manage monitors: Create, update, and delete monitors via API
- Tags and folders: Organize monitors with tags and folders
Choosing your PageCrawl plan
PageCrawl's Free plan lets you monitor 6 pages with 220 checks per month, which is enough to validate the approach on your most critical pages. Most teams graduate to a paid plan once they see the value.
| Plan | Price | Pages | Checks / month | Frequency |
|---|---|---|---|---|
| Free | $0 | 6 | 220 | every 60 min |
| Standard | $8/mo or $80/yr | 100 | 15,000 | every 15 min |
| Enterprise | $30/mo or $300/yr | 500 | 100,000 | every 5 min |
| Ultimate | $99/mo or $999/yr | 1,000 | 100,000 | every 2 min |
Annual billing saves two months across every paid tier. Enterprise and Ultimate scale up to 100x if you need thousands of pages or multi-team access.
Building a custom dashboard requires API access, which starts on the Enterprise plan at $300/year. That covers 500 monitors at 5-minute intervals - more than enough data to feed a meaningful internal dashboard tracking dozens of competitors, docs pages, or product listings. Ultimate at $999/year scales to 1,000 pages with 2-minute checks, suited for teams aggregating monitoring data across large catalogs or multiple clients. All plans include the PageCrawl MCP Server, so developers can query their monitoring data conversationally through Claude or Cursor, pulling change summaries and historical data without writing API calls by hand. AI assistants can create monitors through conversation on every plan, including Free.
Getting Started
Authentication
All API requests require authentication using your API key. You can find your API key in your PageCrawl account settings.
Include the key in the Authorization header:
Authorization: Bearer YOUR_API_KEYBase URL
All API endpoints use the base URL for your PageCrawl account. API responses are returned in JSON format.
Rate Limits
The API has rate limits to prevent abuse. For most accounts, the limit is 60 requests per minute. If you exceed the limit, you will receive a 429 status code. Implement exponential backoff in your code to handle rate limiting gracefully.
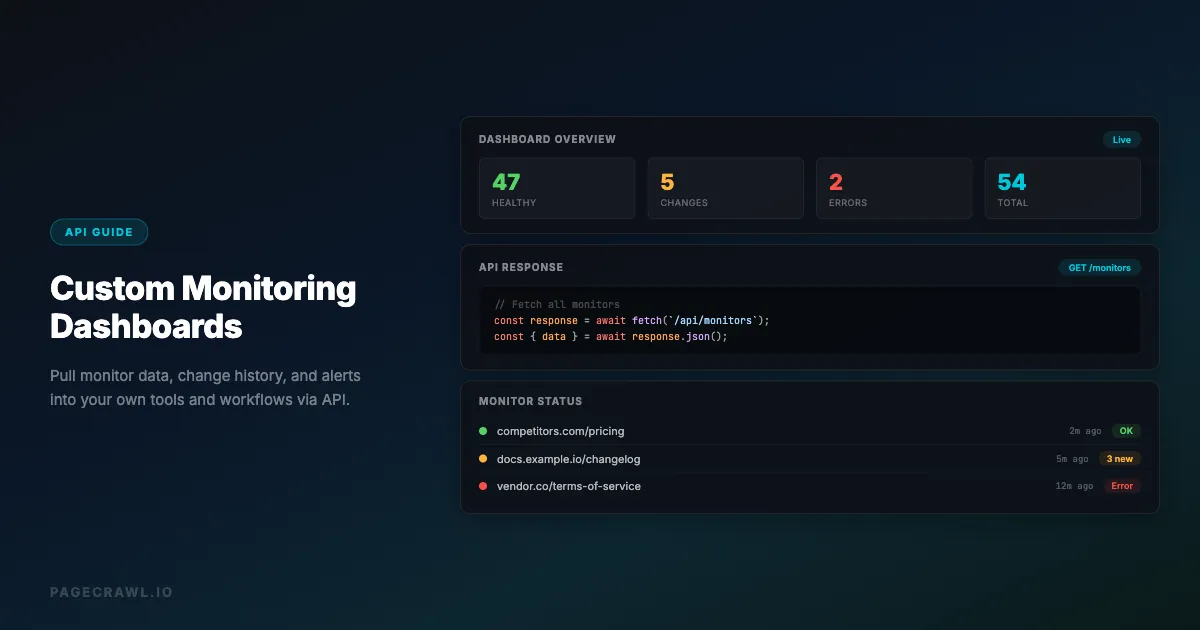
Building a Status Dashboard
The most common use case is a dashboard that shows the current status of all your monitors at a glance.
Fetching Monitor Status
Start by fetching your list of monitors. The response includes the current status of each monitor, which tells you whether each page is being monitored successfully or has issues.
Key fields to display:
- name: The display name of the monitor
- url: The URL being monitored
- status: Current status (ok, unchanged, pending, or error statuses like timeout, blocked, 404)
- failed: Number of consecutive failures (0 means healthy)
- last_checked_at: When the last check was performed
- unseen: Number of detected changes that haven't been reviewed
Building the Dashboard Layout
A useful status dashboard groups monitors by status:
- Monitors with errors (failed > 0) at the top, highlighted in red
- Monitors with unseen changes next, highlighted in yellow
- Healthy monitors at the bottom, in green
This layout immediately draws attention to monitors that need action.
Example: Python Status Dashboard
import requests
from datetime import datetime

API_KEY = "your_api_key_here"
BASE_URL = "https://app.pagecrawl.io/api"

headers = {"Authorization": f"Bearer {API_KEY}"}

def get_monitors():
    response = requests.get(f"{BASE_URL}/monitors", headers=headers)
    return response.json()["data"]

def categorize_monitors(monitors):
    errors = [m for m in monitors if m["failed"] > 0]
    changes = [m for m in monitors if m["unseen"] > 0 and m["failed"] == 0]
    healthy = [m for m in monitors if m["unseen"] == 0 and m["failed"] == 0]
    return errors, changes, healthy

monitors = get_monitors()
errors, changes, healthy = categorize_monitors(monitors)

print(f"=== Monitor Status Dashboard ===")
print(f"Errors: {len(errors)} | Changes: {len(changes)} | Healthy: {len(healthy)}")
print()

if errors:
    print("--- ERRORS ---")
    for m in errors:
        print(f"  [{m['status']}] {m['name']} - {m['url']}")
        print(f"    Failed {m['failed']} consecutive times")

if changes:
    print("--- UNSEEN CHANGES ---")
    for m in changes:
        print(f"  {m['name']} - {m['unseen']} unseen changes")
Building a Change Feed
A change feed shows recent changes across all your monitors in chronological order, similar to an activity feed, and the same website change signals can feed GTM tools like Clay.
Fetching Change History
For each monitor, you can fetch its check history filtered to only show checks where changes were detected. This gives you a chronological list of what changed and when.
Displaying Changes
For each detected change, display:
- Monitor name and URL: Which page changed
- Detection time: When the change was detected
- AI summary: A plain-language description of what changed (if AI summaries are enabled)
- Change severity: Whether the change was minor (cosmetic) or significant (content change)
Example: Change Feed in JavaScript
async function getRecentChanges(monitorId) {
  const response = await fetch(
    `${BASE_URL}/monitors/${monitorId}/history?changes_only=true&limit=10`,
    { headers: { Authorization: `Bearer ${API_KEY}` } }
  );
  const data = await response.json();
  return data.data;
}

async function buildChangeFeed(monitors) {
  const allChanges = [];

  for (const monitor of monitors) {
    const changes = await getRecentChanges(monitor.id);
    for (const change of changes) {
      allChanges.push({
        monitorName: monitor.name,
        monitorUrl: monitor.url,
        detectedAt: change.created_at,
        summary: change.ai_summary || "Change detected",
      });
    }
  }

  // Sort by detection time, newest first
  allChanges.sort(
    (a, b) => new Date(b.detectedAt) - new Date(a.detectedAt)
  );

  return allChanges;
}
Building a Price Tracking Dashboard
If you are monitoring product prices rather than re-scraping them on a schedule, you can build a dashboard that shows price history and alerts you to price drops.
Tracking Price Changes
When you use element tracking to monitor a price element (like .price or [itemprop="price"]) or another numeric value such as a bank savings or CD rate, PageCrawl records the extracted value on each check. You can pull this history to build a price chart.
Example: Price History Chart Data
def get_price_history(monitor_id):
    response = requests.get(
        f"{BASE_URL}/monitors/{monitor_id}/history",
        headers=headers,
        params={"limit": 100}
    )
    checks = response.json()["data"]

    prices = []
    for check in checks:
        if check.get("tracked_value"):
            # Extract numeric price from tracked value
            price_str = check["tracked_value"]
            price = float(price_str.replace("$", "").replace(",", ""))
            prices.append({
                "date": check["created_at"],
                "price": price
            })

    return prices
You can feed this data into any charting library (Chart.js, D3, Plotly) to visualize price trends over time.
Automating with Webhooks
For real-time dashboards, polling the API on a schedule works but introduces delay. Webhooks provide instant notifications when changes are detected.
Setting Up Webhooks
Configure a webhook URL in your PageCrawl monitor settings. When a change is detected, PageCrawl sends a POST request to your URL with details about the change.
Webhook Payload
The webhook includes:
- Monitor information (name, URL, ID)
- The detected change details
- AI summary (if enabled)
- Timestamp of detection
Example: Webhook Receiver
from flask import Flask, request, jsonify

app = Flask(__name__)

# In-memory store for demo purposes
recent_changes = []

@app.route("/webhook", methods=["POST"])
def handle_webhook():
    data = request.json

    change = {
        "monitor_name": data.get("monitor", {}).get("name"),
        "url": data.get("monitor", {}).get("url"),
        "summary": data.get("summary", "Change detected"),
        "received_at": datetime.now().isoformat()
    }

    recent_changes.insert(0, change)
    # Keep only last 100 changes
    if len(recent_changes) > 100:
        recent_changes.pop()

    return jsonify({"status": "ok"}), 200

@app.route("/dashboard")
def dashboard():
    return jsonify({"changes": recent_changes[:20]})
Integrating with Existing Tools
Grafana Dashboard
If your team uses Grafana for infrastructure monitoring, you can add PageCrawl data to your existing dashboards using the JSON API datasource plugin.
- Install the JSON API datasource plugin in Grafana
- Configure it with your PageCrawl API base URL and API key
- Create panels that query monitor status, change counts, and check history
- Set up Grafana alerts based on monitor failure counts
This puts website monitoring alongside your infrastructure metrics in a single dashboard.
Slack Bot
Build a Slack bot that responds to commands with monitoring status:
/monitors status- Show a summary of all monitors/monitors changes- Show recent changes/monitors check <url>- Trigger an immediate check
# Slack slash command handler
def handle_slack_command(command_text):
    if command_text == "status":
        monitors = get_monitors()
        errors = [m for m in monitors if m["failed"] > 0]
        changes = [m for m in monitors if m["unseen"] > 0]

        return {
            "text": f"*Monitor Status*\n"
                    f"Total: {len(monitors)}\n"
                    f"Errors: {len(errors)}\n"
                    f"Unseen changes: {len(changes)}"
        }
Google Sheets
Export monitoring data to Google Sheets for reporting:
import gspread

def export_to_sheets():
    monitors = get_monitors()
    gc = gspread.service_account()
    sheet = gc.open("Monitor Report").sheet1

    # Write headers
    sheet.update("A1", [["Name", "URL", "Status", "Last Check", "Changes"]])

    # Write data
    rows = []
    for m in monitors:
        rows.append([
            m["name"],
            m["url"],
            m["status"],
            m["last_checked_at"],
            m["unseen"]
        ])
    sheet.update("A2", rows)
Dashboard Design Patterns
Summary Cards
Show key metrics at the top of your dashboard:
- Total monitors: How many pages you are tracking
- Active errors: Monitors that are failing
- Changes today: Number of changes detected in the last 24 hours
- Average response time: How quickly monitored pages are loading
Timeline View
Display changes on a timeline, grouped by day. This shows the cadence of changes across all your monitors and helps identify patterns (e.g., a website that always updates on Tuesdays).
Grouped by Category
If you use tags or folders to organize monitors, display them in groups:
- Competitor websites: Show competitor monitors together for easy comparison
- Product prices: Group all price monitors with their current values (you can even turn websites into API data sources to feed your dashboard)
- Documentation: Show all documentation monitors and their last change dates
- Compliance: Group regulatory and compliance monitors with their review status
Alert History
Keep a log of all alerts sent, showing:
- When each alert was triggered
- Which monitor triggered it
- What notification channels received the alert
- Whether the alert was acknowledged
Performance Considerations
Caching
Do not call the API on every page load. Cache monitor data for 1-5 minutes depending on how fresh you need the data. Use the webhook approach for real-time updates and the API for periodic full refreshes.
Pagination
The API returns paginated results for large datasets. When you have many monitors or a long check history, use pagination parameters to fetch data in batches rather than requesting everything at once.
Batch Requests
If you need data for multiple monitors, fetch the monitor list first (which includes basic status information), then only fetch detailed history for monitors that have recent changes or errors. This reduces the number of API calls.
Common Dashboard Integrations
| Integration | Use Case | Approach |
|---|---|---|
| Grafana | Infrastructure team monitoring | JSON API datasource |
| Google Sheets | Weekly reports | Scheduled Python script |
| Slack | Team notifications | Webhook + Slack API |
| Discord | Community monitoring | Webhook + Discord API |
| Notion | Project documentation | API + Notion integration |
| Jira | Issue tracking | Create tickets on change detection |
| PagerDuty | Critical page monitoring | Webhook to PagerDuty events |
| Microsoft Teams | Enterprise notifications | Webhook + Teams connector |
Getting Started
To build your first custom dashboard:
- Get your API key from your PageCrawl account settings
- Start with the monitor list endpoint to understand the data structure
- Build a simple status page that categorizes monitors by health
- Add change history for monitors with recent updates
- Set up webhooks for real-time updates if needed
A basic status dashboard can be built in under an hour using any web framework. From there, customize it to match your team's specific workflow and reporting needs.