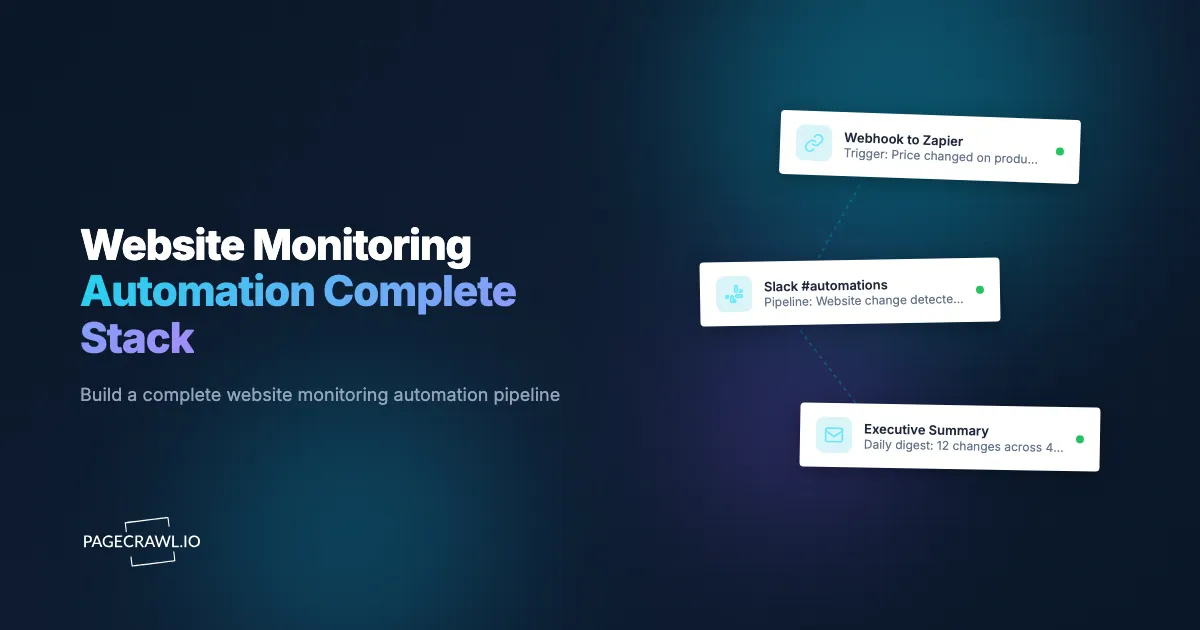
A competitor changes their pricing page at 2:00 PM. By 2:05 PM, a webhook fires. By 2:06 PM, the change is logged in a database, a Slack message is posted to the competitive intelligence channel, and a task is created in the project management tool assigned to the pricing analyst. By 2:30 PM, the analyst has reviewed the change, updated the competitive pricing spreadsheet, and flagged the insight for the next strategy meeting. Nobody refreshed a webpage. Nobody checked a dashboard. The entire pipeline, from detection to actionable intelligence, ran automatically.
This is what monitoring automation looks like when all the pieces work together. Most teams start with basic monitoring: watch a page, get a notification, manually take action. That works for 5 or 10 monitors. But as monitoring scales to dozens or hundreds of pages across competitive intelligence, compliance, pricing, and brand protection, the manual steps between detection and action become the bottleneck. The notification arrives, but the follow-up depends on someone seeing it, remembering what to do, and doing it consistently.
This guide covers how to build a complete monitoring automation stack, from the detection layer through processing, action, and storage, with real-world architecture examples and step-by-step setup instructions.
The Four Layers of Monitoring Automation
A complete monitoring automation stack has four layers, each with a specific role.
Layer 1: Detection
The detection layer watches web pages and identifies changes. This is where PageCrawl operates. Monitors check pages at configured intervals, compare content to the previous version, and determine whether a meaningful change occurred. The detection layer outputs structured change data: what changed, when, where, and an AI summary of the change.
Detection alone (a monitor plus a notification) is useful but limited. You know something changed, but the response depends entirely on manual effort.
Layer 2: Processing
The processing layer receives raw change data from the detection layer and transforms, filters, enriches, or routes it. This is where webhooks and automation platforms operate. The processing layer answers questions like:
- Is this change relevant to my use case, or is it noise?
- Which team or person should handle this change?
- What additional context does this change need before it is actionable?
- Should this change trigger one action or many?
Processing turns raw detection into categorized, enriched, routed intelligence.
Layer 3: Action
The action layer executes responses to detected changes. Actions can be notifications (Slack, email, Telegram), data operations (database inserts, spreadsheet updates), task creation (tickets, assignments), or external API calls (CRM updates, price adjustments). The action layer is where monitoring produces business value.
Layer 4: Storage
The storage layer preserves change history for analysis, compliance, and trend identification. Screenshots, diffs, AI summaries, and metadata are stored for future reference. The storage layer enables dashboards, reports, and pattern analysis that turn individual change events into strategic insight over time.
Layer 1: Detection with PageCrawl
PageCrawl handles the detection layer with several capabilities that feed into automation.
Monitor Types and Their Automation Value
Different tracking modes produce different types of structured data, which affects what you can automate downstream.
Full page monitoring detects any change to the page content. This generates the most change events and the broadest data. Useful for compliance monitoring, archival, and situations where any change matters.
Content-only monitoring strips navigation, ads, and boilerplate to focus on primary content. This reduces noise and produces cleaner change data for downstream processing. Ideal for news pages, blog posts, and documentation.
Price tracking extracts structured price data (current price, original price, availability). This produces numerical data that is directly usable in calculations, comparisons, and conditional logic. Ideal for competitive pricing pipelines.
Availability tracking watches for stock status changes. This produces binary data (in stock / out of stock) that is straightforward to automate. Ideal for restock alerts and inventory monitoring.
Specific element tracking monitors a CSS or XPath selector. This produces focused change data for a precise portion of the page. Ideal for tracking specific data points like API status, version numbers, or individual metrics.
AI Summaries as Automation Input
PageCrawl's AI-generated change summaries are not just for human consumption. In an automation stack, the summary text becomes an input for downstream processing. An AI summary like "Enterprise plan price increased from $299 to $399/month" contains structured intelligence that automation workflows can parse and act on.
Screenshots as Evidence
Automated screenshots capture the visual state of the page at the time of detection. In a storage layer, these screenshots create a visual archive. In a compliance pipeline, they serve as evidence. Screenshots can also be attached to Slack messages, tickets, and reports generated by the action layer.
Layer 2: Processing with Webhooks
Webhooks are the bridge between detection and everything else. When PageCrawl detects a change, it sends an HTTP POST request to your specified endpoint with structured JSON data. Our webhook automation guide covers the basics of webhook setup. Here, we focus on the processing patterns that make webhooks powerful.
Pattern 1: Filter and Route
Not every detected change needs every action. A filter examines the webhook payload and routes it based on conditions:
- By monitor tag or folder: Changes from competitive pricing monitors go to the pricing team channel. Changes from regulatory monitors go to the compliance team.
- By change content: Only forward price decreases to the sales team. Only forward new product additions to the product team.
- By severity: Minor changes get logged but not notified. Major changes trigger immediate alerts across multiple channels.
Automation platforms like n8n, Zapier, and Make handle this routing logic without code. For our detailed n8n integration, see the n8n website monitoring guide. For Zapier setups, see our Zapier monitoring guide.
Pattern 2: Enrich
Add context to the raw change data before acting on it:
- Look up the monitor in your database to add business context (customer name, product category, priority level)
- Query an external API to add market data, competitor information, or historical context
- Combine multiple webhook events to build a composite view (all pricing changes across competitors in the last 24 hours)
Enrichment transforms raw "this page changed" data into "this competitor raised their enterprise price by 33%, the third increase this year, and they are now $100 above our equivalent plan" intelligence.
Pattern 3: Deduplicate and Aggregate
Some monitored pages change frequently with minor variations. Processing can deduplicate similar changes and aggregate related events:
- If the same page triggers 3 changes in one day, send a single daily digest instead of 3 separate alerts
- Aggregate all competitive pricing changes across multiple monitors into a single weekly competitive pricing report
- Suppress duplicate alerts when the same change is detected across mirrored pages
Pattern 3: Transform
Convert webhook data into the format needed by downstream systems:
- Transform the JSON payload into a format your CRM accepts
- Convert timestamps to your team's time zone
- Extract specific fields and discard others
- Generate formatted messages for different notification channels
Layer 3: Action Implementations
The action layer is where monitoring produces business outcomes. Here are concrete implementations for common use cases.
Notifications Across Channels
Slack: Post formatted messages to team channels. Include the page name, AI summary, screenshot, and a link to the full diff. Different channels for different monitor categories (pricing-intel, compliance-alerts, brand-mentions).
Telegram: Send instant alerts to individuals or groups. Telegram's fast push notification delivery makes it ideal for time-sensitive changes where immediate awareness matters.
Email: Daily or weekly digest emails compiling all detected changes. Email works well for changes that need documentation rather than immediate response.
Discord: Community-oriented notifications. Useful for teams using Discord as their primary communication platform. See how to configure multi-channel notifications in our push notification guide.
Microsoft Teams: Enterprise team notifications routed to specific channels based on change category.
Data Operations
Spreadsheet updates: When a competitor changes pricing, automatically add a row to a Google Sheet or Excel file with the date, competitor name, old price, new price, and source URL. Over time, this builds a comprehensive pricing history database.
Database inserts: Write change events to a SQL database or data warehouse. Each detected change becomes a record with structured fields (monitor ID, URL, change type, summary, timestamp, screenshot URL). This data feeds dashboards and analytics.
API calls: Update records in your CRM, ERP, or internal tools. When a tracked vendor page changes, update the vendor record in your procurement system. When a monitored job posting changes, update your recruiting pipeline.
Task and Ticket Creation
Project management: Create tasks in Asana, Jira, Linear, or Monday.com when a material change is detected. Assign the task to the appropriate team member based on the monitor category. Include the change summary and diff link in the task description.
Support tickets: When customer-facing services show changes (status pages, documentation updates), create internal tickets to review the impact on your product or integrations.
Legal review requests: When TOS or privacy policy monitors detect changes, create a review request in your legal team's system with the change details and affected vendor.
Automated Responses
Price matching: When a competitor lowers their price, trigger a workflow that alerts the pricing team and queues a pricing review. For automated e-commerce operations, this could directly adjust prices within guardrails.
Content updates: When a monitored industry page publishes new data, extract the data and update your own content or database. For example, monitoring regulatory pages and automatically updating your compliance documentation index.
Incident response: When a vendor status page shows a new incident, trigger your incident response workflow: notify affected teams, update your status page, and open an investigation ticket.
Layer 4: Storage and Analysis
The storage layer transforms monitoring from a real-time alerting system into a strategic intelligence platform.
Building a Change Archive
Every detected change should be stored with its full context:
- Timestamp: When the change was detected
- Source: The monitored URL and page name
- Change type: What kind of change (price, content, availability, new page)
- AI summary: The plain-language description of the change
- Diff: The exact textual changes
- Screenshot: Visual capture of the page state
- Metadata: Monitor tags, categories, and any enrichment data
PageCrawl maintains this archive automatically. For organizations that want to integrate this data with other systems, the API and webhook data provide all of these fields. Our website archiving guide covers the archival capabilities in detail.
Dashboards and Reporting
Stored change data powers dashboards that show:
- Competitive activity timeline: A visual timeline of all competitor website changes over the past 30, 60, or 90 days
- Price trend charts: Historical pricing data across competitors, showing trends and patterns
- Regulatory change calendar: A calendar view of all detected regulatory changes with their effective dates
- Change volume metrics: How frequently each monitored source changes, identifying the most dynamic sources
Building custom dashboards with the PageCrawl API is covered in our monitoring dashboard guide.
Pattern Analysis
Historical data reveals patterns that individual change events cannot:
- Competitive pricing patterns: A competitor raises prices every January and offers discounts every November. This pattern informs your own pricing strategy.
- Regulatory publication cadence: A regulatory body publishes guidance documents on the first Monday of each month. This pattern helps predict when to expect new content.
- Content update frequency: A competitor publishes blog posts every Tuesday and Thursday. Unusual gaps or bursts may signal strategic changes.
- Seasonal availability patterns: Product restocks follow weekly cycles. Understanding the pattern improves monitoring timing.
Real-World Architecture Examples
Abstract concepts become concrete with specific implementations. Here are three complete monitoring automation architectures.
Architecture 1: Competitive Intelligence Pipeline
Goal: Track competitor pricing, features, and messaging across 15 competitors to inform product and pricing strategy.
Detection layer: 60 PageCrawl monitors.
- 15 pricing pages (one per competitor, price tracking mode)
- 15 feature/product pages (content-only mode)
- 15 blog/news pages (content-only mode)
- 15 job posting pages (content-only mode)
Processing layer: n8n workflow receiving webhooks.
- Categorizes changes by type (pricing, feature, content, hiring)
- Enriches with competitor metadata from internal database
- Filters out minor changes (less than 5% of page content changed)
- Aggregates daily changes into a summary
Action layer:
- Pricing changes: Immediate Slack notification to #pricing-intel with before/after prices, plus row added to competitive pricing spreadsheet
- Feature changes: Slack notification to #product-intel, task created in product backlog
- Blog/news changes: Weekly digest email to leadership team
- Hiring changes: Notification to #market-intel channel
Storage layer:
- All changes stored in PostgreSQL database via webhook-to-database pipeline
- Monthly competitive intelligence report auto-generated from stored data
- Pricing trend dashboard updated in real time
Cost: PageCrawl Standard plan ($80/year) for 60 monitors, self-hosted n8n (free), existing Slack and database infrastructure.
Architecture 2: Compliance Monitoring Pipeline
Goal: Track regulatory changes across 8 regulatory bodies and 20 vendor policy pages to maintain compliance.
Detection layer: 45 PageCrawl monitors.
- 8 regulatory body news/update pages (content-only mode)
- 5 Federal Register section pages (content-only mode)
- 12 vendor TOS pages (content-only mode)
- 12 vendor privacy policy pages (content-only mode)
- 8 industry standard body pages (content-only mode)
Processing layer: Zapier or Make workflow.
- Classifies changes as regulatory, vendor policy, or industry standard
- Assigns severity based on keywords (mandatory, penalty, deadline, effective date)
- Routes to appropriate compliance team member
Action layer:
- High-severity regulatory changes: Immediate email to compliance officer, Jira ticket created in Compliance project
- Vendor policy changes: Email to legal team, logged in vendor management system
- Industry standard updates: Weekly email digest to compliance team
- All changes: Logged in compliance tracking spreadsheet with date, source, summary, and status
Storage layer:
- Change archive in compliance management platform
- Screenshots stored for audit trail
- Quarterly compliance review report drawing from stored change history
Cost: PageCrawl Standard plan ($80/year), Zapier or Make subscription ($20-50/month), existing compliance management tools.
Architecture 3: E-Commerce Price Intelligence Pipeline
Goal: Monitor 200 product prices across 10 retailers to optimize pricing in real time.
Detection layer: 200 PageCrawl monitors (price tracking mode).
- 20 key products tracked across 10 retailers
- Monitors configured to track price and availability
Processing layer: Custom webhook endpoint (Node.js or Python service).
- Parses price data from webhook payload
- Compares against your current prices stored in database
- Calculates price position (above, below, or matching competitor)
- Flags significant deviations (more than 10% below your price)
Action layer:
- Price drops below threshold: Alert to pricing manager via Telegram, row highlighted in pricing dashboard
- Out-of-stock competitor: Opportunity alert to sales team (chance to capture demand)
- Price increases by competitors: Flag for potential own price adjustment
- Bulk pricing report: Daily email summarizing all price changes across all competitors
Storage layer:
- Price history database with every detected price point
- Dashboard showing current competitive positioning (your price vs. average competitor price by product)
- Historical price trend charts for each product and competitor
- Weekly and monthly pricing intelligence reports auto-generated
Cost: PageCrawl Enterprise plan ($300/year) for 200 monitors, custom webhook service (hosted on existing infrastructure), existing database. For turning website data into structured feeds, see our website-to-API guide.
Building the Stack Step by Step
You do not need to build all four layers at once. Start simple and add complexity as your needs grow.
Phase 1: Detection and Notification (Day 1)
Start with PageCrawl monitors and built-in notifications. No webhooks, no automation platform, no custom code. This phase proves the value of monitoring and identifies which changes matter most.
- Set up 5 to 10 monitors for your highest-priority pages
- Configure Slack or email notifications
- Use PageCrawl's review boards to triage detected changes collaboratively with your team
- Spend a week observing what changes are detected
- Note which changes require manual follow-up and what that follow-up involves
Review boards deserve special attention in Phase 1 because they bridge the gap between raw notifications and full automation. Before you build webhook pipelines and processing workflows, the review board gives your team a shared interface where all detected changes appear in one place. Team members can mark changes as reviewed, flag important findings, and see which changes others have already handled. This manual-but-organized step helps you understand your change patterns well enough to design the automation that follows in later phases.
Phase 2: Processing and Routing (Week 2-3)
Add webhooks and a basic automation workflow. This phase eliminates the most repetitive manual steps.
- Configure webhook notifications on your monitors
- Set up an n8n, Zapier, or Make workflow to receive webhooks
- Implement basic routing: different changes go to different channels or people
- Add one or two automated actions (spreadsheet logging, task creation)
Phase 3: Action Automation (Month 2)
Expand the action layer to handle more response patterns automatically.
- Add more downstream integrations (CRM updates, ticket creation, database inserts)
- Implement filtering and enrichment in the processing layer
- Create automated reports from accumulated change data
- Expand the monitor count as you identify new pages worth watching
Phase 4: Storage and Intelligence (Month 3+)
Build the storage and analysis capabilities that turn monitoring into a strategic intelligence platform.
- Set up a database for long-term change storage
- Build dashboards from stored data
- Implement pattern analysis and trend reporting
- Create automated periodic reports (weekly, monthly, quarterly)
Scaling Considerations
As monitoring automation scales, several factors affect performance and cost.
Monitor Volume and Plan Selection
PageCrawl plans scale by monitor count:
- Free: 6 monitors (Phase 1 pilot)
- Standard: 100 monitors at $80/year (most automation use cases)
- Enterprise: 500 monitors at $300/year (large-scale intelligence operations)
For most organizations, the Standard plan handles competitive intelligence, compliance, and brand monitoring with room to spare. The Enterprise plan supports large-scale pricing intelligence and multi-domain monitoring programs.
Webhook Reliability
Webhook-based architectures need endpoints that are always available. If your webhook receiver is down when a change fires, you miss the event. Solutions:
- Use a queue-based webhook receiver that stores events even if downstream processing is temporarily unavailable
- Automation platforms like n8n and Zapier handle webhook reliability for you
- For custom endpoints, implement retry logic and persistent storage
Processing Throughput
When hundreds of monitors are running, webhook events can cluster (e.g., many pages check at the same time and several detect changes). Your processing layer needs to handle bursts without dropping events or creating delays.
Automation platforms handle this naturally through their execution queues. Custom solutions should use message queues (Redis, RabbitMQ) to decouple webhook receipt from processing.
Cost Optimization
The monitoring automation stack has several cost components:
- Detection: PageCrawl plan ($0-300/year)
- Processing: Automation platform ($0-50/month for most use cases) or self-hosted ($0 for n8n)
- Action: Most action integrations (Slack, email, webhook-to-spreadsheet) are free within existing tool subscriptions
- Storage: Database hosting ($0-20/month for most volumes) or existing infrastructure
A complete monitoring automation stack running 100 monitors with processing, actions, and storage can operate for under $200/year. This is dramatically less expensive than manual monitoring labor or enterprise competitive intelligence subscriptions.
Advanced Patterns
Once the basic stack is running, advanced patterns increase its value.
Cross-Monitor Correlation
Detect patterns that span multiple monitors:
- A competitor updates their pricing page and their feature page on the same day, suggesting a product launch or repositioning
- Multiple regulatory bodies publish related guidance within the same week, signaling coordinated regulatory action
- A vendor's status page shows degradation while their TOS page updates liability language, potentially connected events
Cross-monitor correlation requires storing events and querying across them, which the storage layer enables.
Conditional Automation Chains
Build multi-step automation chains where each step depends on the previous:
- PageCrawl detects a competitor pricing change
- Webhook fires to processing layer
- Processing layer queries your price database to compare
- If competitor price is now lower than yours, create a high-priority alert
- If the price gap exceeds 20%, also create a task for the pricing team with a recommended response
- If the competitor has lowered prices 3 times in the past month, flag the pattern for strategic review
These conditional chains turn monitoring from event-by-event alerting into intelligent, context-aware automation.
Feedback Loops
Create loops where automation outcomes feed back into monitoring configuration:
- When a monitor consistently detects irrelevant changes, automatically adjust its sensitivity or tracking mode
- When a new competitor is identified through market monitoring, automatically create monitors for their key pages
- When a product goes out of stock at a retailer, automatically increase check frequency to catch the restock
Feedback loops create monitoring systems that improve and adapt over time without manual reconfiguration.
Home Automation Integration
For personal monitoring automation, the stack extends into home automation. The easiest path is PageCrawl's native Home Assistant integration, installed through HACS and connected with a one-click OAuth sign-in (no API token, works on free accounts). It turns each monitor into a device with typed sensors for every tracked element, a "Check now" button, and a pagecrawl_change event you can use in automations to flash lights when a product restocks, light up a dashboard, or alert through a smart speaker. For fully custom flows, PageCrawl's webhooks still drive your own Home Assistant automations. See our Home Assistant webhook integration guide for detailed setup instructions.
Choosing your PageCrawl plan
PageCrawl's Free plan lets you monitor 6 pages with 220 checks per month, which is enough to validate the approach on your most critical pages. Most teams graduate to a paid plan once they see the value.
| Plan | Price | Pages | Checks / month | Frequency |
|---|---|---|---|---|
| Free | $0 | 6 | 220 | every 60 min |
| Standard | $8/mo or $80/yr | 100 | 15,000 | every 15 min |
| Enterprise | $30/mo or $300/yr | 500 | 100,000 | every 5 min |
| Ultimate | $99/mo or $999/yr | 1,000 | 100,000 | every 2 min |
Annual billing saves two months across every paid tier. Enterprise and Ultimate scale up to 100x if you need thousands of pages or multi-team access.
Standard at $80/year pays for itself the moment the automation stack catches a competitor pricing change, a vendor policy update, or a regulatory shift that would otherwise have taken days to surface manually. 100 monitored pages is the right scale for most complete stacks, covering competitive intelligence, compliance, and brand monitoring with room for the webhook and storage layers to run on top. Enterprise at $300/year adds 5-minute checks, 500 pages, and full API access for custom pipeline integrations.
All plans include the PageCrawl MCP Server, which plugs into Claude, Cursor, and other MCP-compatible tools so your team can query the monitoring archive directly rather than building separate reporting workflows. AI assistants can create monitors through conversation on every plan, including Free.
Getting Started
Building a monitoring automation stack starts with two decisions: what do you want to monitor, and what do you want to happen when something changes? The detection layer (PageCrawl) and a single automation (Slack notification or spreadsheet logging) is enough to prove value. From there, you add processing, actions, and storage based on what the data tells you is worth automating.
Start with 5 to 10 monitors on your highest-priority pages. Configure webhook notifications. Set up a basic workflow in n8n (self-hosted, free) or Zapier (hosted, paid) that receives the webhook and takes one action: posting to Slack, adding a spreadsheet row, or creating a task. Run this for two weeks and observe.
PageCrawl's free tier with 6 monitors gets the detection layer running at no cost. The Standard plan at $80/year supports 100 monitors, which is sufficient for most monitoring automation stacks covering competitive intelligence, compliance, and brand protection. The Enterprise plan at $300/year supports 500 monitors for large-scale pricing intelligence and multi-domain monitoring operations.
The stack grows naturally. Each time you find yourself manually doing something after a change notification, that is a candidate for automation. Each time you wish you could see a trend over time, that is a candidate for storage and dashboards. The complete stack does not need to be built in a day. It needs to be built in response to real needs, one layer at a time.
Create a free PageCrawl account and start building your monitoring automation pipeline.