At 8:30:00 a.m. Eastern on the first Friday of the month, the Bureau of Labor Statistics posts the Employment Situation, and the figure that matters most, nonfarm payrolls, is live on the release page before most desks have finished their first coffee. Anyone who has tried to catch it manually knows how the next few seconds go: three browser tabs open, hammering refresh, and the page still loads some seconds after the print. By the time you read the headline number, two-year Treasury yields have already lurched and the desk chat is a wall of red. A handful of seconds is an eternity when a payrolls surprise can reprice rate-cut odds inside a single minute.
Economic data releases are unusual among market-moving events because their timing is published months in advance, yet the content itself is embargoed to the exact second. Everyone knows the CPI report lands on a specific Tuesday at 8:30 a.m. ET. Nobody is supposed to know the number until that instant, when it appears on the agency's website. That combination, a fixed calendar plus a single-second reveal, is precisely what a monitoring tool is built for. You only need to be among the first to see the page once it changes.
This guide covers which BLS and BEA releases move markets, why the 8:30 a.m. print is the moment that counts, how data revisions work (and why a revised prior month can matter as much as the fresh figure), and how to set up release monitoring in PageCrawl, from the release page down to the exact JSON field in the agency data API.
Which economic data releases are worth monitoring?
The releases that move markets cluster at two federal agencies and almost all land at 8:30 a.m. ET. The Bureau of Labor Statistics (BLS) publishes CPI, the Employment Situation jobs report, the Producer Price Index, and JOLTS. The Bureau of Economic Analysis (BEA) publishes Personal Income and Outlays, which carries the PCE price index, plus quarterly GDP.
Each release has a fixed rhythm worth knowing before you build any monitor:
| Release | Agency | Typical cadence | Key figures |
|---|---|---|---|
| Employment Situation | BLS | First Friday, 8:30 a.m. ET | Nonfarm payrolls, unemployment rate, average hourly earnings |
| Consumer Price Index (CPI) | BLS | Mid-month, 8:30 a.m. ET | Headline CPI, core CPI (ex food and energy), year over year |
| Producer Price Index (PPI) | BLS | Mid-month, 8:30 a.m. ET | Final demand PPI, core PPI |
| JOLTS | BLS | Early month, 10:00 a.m. ET | Job openings, quits, hires |
| Personal Income and Outlays | BEA | Late month, 8:30 a.m. ET | PCE price index, core PCE (the Fed's preferred gauge) |
| Gross Domestic Product (GDP) | BEA | Quarterly, 8:30 a.m. ET | Real GDP growth, three sequential estimates |
The core PCE price index deserves special attention because it is the inflation measure the Federal Reserve targets against its stated 2 percent longer-run goal. A PCE surprise can reprice the entire rates curve, which is why economic data monitoring pairs naturally with watching the central bank itself. If you already track the wording of Fed policy statements for subtle shifts, adding the data prints that feed those decisions completes the picture.
Why does the 8:30 a.m. ET print matter so much?
Because the entire release becomes public at a single scheduled second, and markets price the headline figure within milliseconds. The value of a monitor is landing on the page in the first checking interval after the embargo lifts, rather than whenever you next remember to refresh. A long delay means trading on a number the rest of the market has already absorbed and moved past.
For years, accredited journalists received these reports in a guarded lock-up room minutes early so wire stories could publish at the bell. That access has been wound down, so the website itself is now the front line. The agency page updates at the scheduled second, and a primary dealer and an independent economist see it at the same instant. The first-mover advantage now belongs to whoever detects the change fastest and routes the figure into their workflow without a human in the loop.
That is a meaningful shift. When the lock-up existed, the headline arrived pre-digested through a newswire. Today the raw release page is the canonical source, and a manual refresh loop is slow and error-prone. An automated monitor on a tight schedule around 8:30 a.m. removes the human reflex entirely: the event is binary, scheduled, and rewards speed.
How do data revisions actually work at BLS and BEA?
Revisions are where casual watchers get caught out. A prior month's figure can be restated weeks later, and a large revision sometimes moves markets more than the fresh print. Both BLS and BEA revise on published schedules, so a monitor should watch for changes to numbers you already filed away as settled.
Nonfarm payroll revisions
Every Employment Situation report revises the two preceding months. So the January report that lands in early February will restate December and November payrolls. These two-month revisions are routine and often substantial. A headline that prints in line with expectations can still be a negative surprise if it comes with a steep downward revision to the prior two months.
Annual benchmark revisions
Once a year, BLS realigns the establishment survey to more complete unemployment-insurance tax records. A preliminary benchmark is released in late summer and the final benchmark is folded into the January data published in February. These can be large: the preliminary benchmark BLS published in August 2024 indicated payrolls had been overstated by roughly 818,000 jobs for the year through March 2024, one of the biggest downward revisions on record. A monitor on the benchmark page catches that on the next check after it posts.
GDP estimates
BEA publishes each quarter's GDP in three passes: the advance estimate about a month after the quarter ends, the second about two months out, and the third about three months out, each refining the prior figure as more source data arrives. BEA also runs annual updates each summer and comprehensive updates roughly every five years. The PCE figures inside Personal Income and Outlays follow a similar pattern, with monthly revisions and an annual update in September.
The practical takeaway: treat the revision as a first-class event. If you only alert on fresh headlines, you will miss the day a quiet restatement of last quarter changes the trend. Number tracking with a change threshold, covered below, is built exactly for catching a value that was supposed to be final but moved.
Should you monitor the release page or the schedule page?
Both, because they answer different questions. The release page tells you what the number is as soon as a check picks up the new text. The release schedule page tells you when the next print is due and flags any unannounced date or time change, which happens during government shutdowns, weather closures, or technical delays. Watching only one leaves a blind spot.
The schedule page is the quieter but underrated monitor. Agencies occasionally shift a release date, and if your calendar is hardcoded to last quarter's dates, a moved CPI print can catch a whole desk flat-footed. A simple keyword or fullpage content monitor on the BLS and BEA schedule pages, the same pattern used for monitoring government agency and public records pages, surfaces those changes days ahead. When you track a whole roster of agency pages at once, setting them up through bulk URL monitoring keeps the schedule and live-release watchers in one organized place.
The release page is the time-critical monitor. Here you want the tightest reasonable check cadence concentrated around the scheduled 8:30 a.m. window, plus screenshots so you have a timestamped capture of exactly what the page said when it changed.
How do you set up economic data release monitoring with PageCrawl?
Setting up a release monitor takes about five minutes and follows the same six steps whether you are watching CPI, the jobs report, or PCE. The goal is to detect the page change in the first check after the embargo lifts and route the figure to wherever your team reacts.

Step 1: Add the release URL and pick a tracking mode. Paste the agency release page (for example the CPI news release or the Employment Situation page) into a new monitor. For the live release, fullpage content tracking is the most robust starting point because the entire release text is your signal. If you only care about one line, use keyword/text tracking scoped to the section that holds the headline figure.
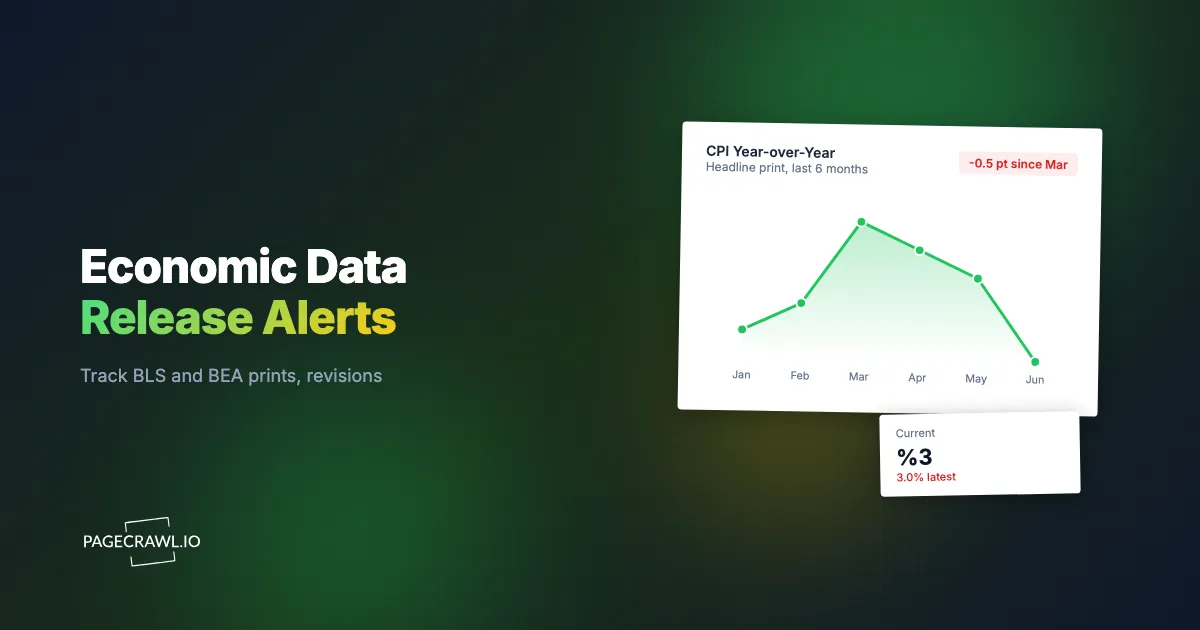
Step 2: Decide what specifically to capture. For a precise number such as the unemployment rate or month-over-month core CPI, use number tracking, which extracts the numeric value and lets you set a threshold and a direction (up or down), and charts the series over time as the help-centre guide to monitoring numeric values to spot trends explains. For the schedule page, fullpage content or keyword tracking is enough. Some agency releases publish as PDFs, and PDF monitoring captures changes inside those documents. PageCrawl renders each page fully before comparing, so dynamically loaded tables and figures are captured reliably.
Step 3: Set the check frequency around the print. Economic releases are scheduled to the minute, so concentrate your checks on the 8:30 a.m. ET window. A frequent cadence in the minutes surrounding the scheduled time means you detect the change within the first checking interval after it publishes. Outside the release window you can check far less often, since nothing changes, and the help-centre guide to check scheduling by day and hour shows how to confine a monitor's checks to the hours that matter.
Step 4: Choose your notification channel. Route alerts to where your team actually watches. Pipe prints into a dedicated Slack channel for change alerts, or to Telegram or Discord for a trading group. For automated reactions, send the change to a webhook that hands the figure straight to your downstream systems so a model, dashboard, or AI agent can act on the new number as soon as it arrives.
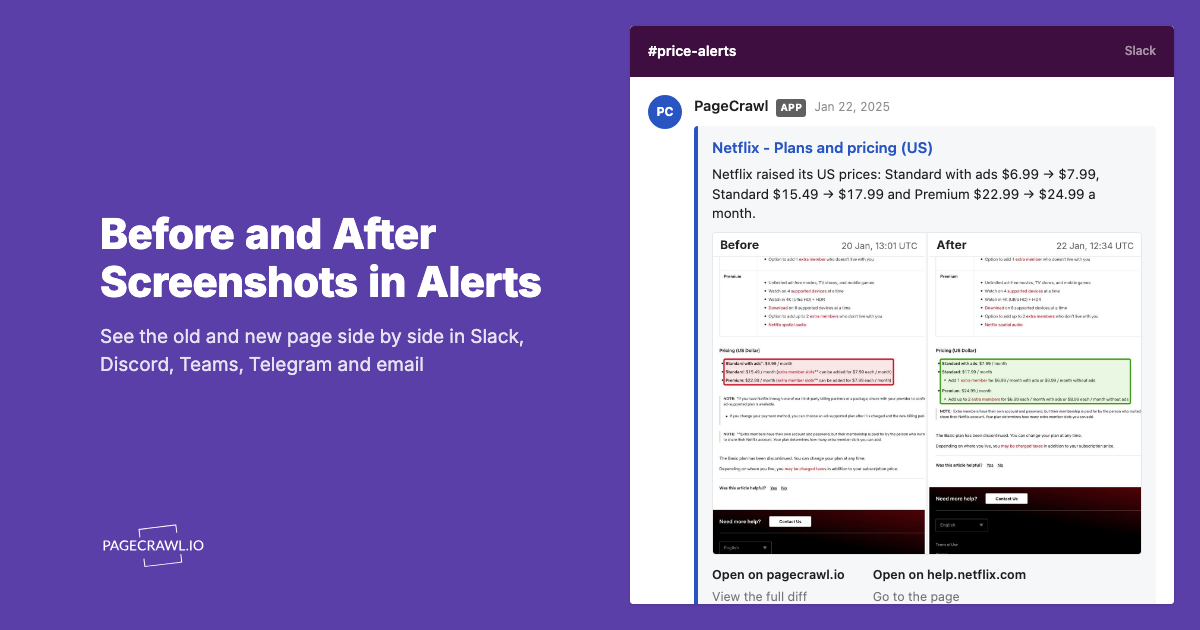
Step 5: Keep screenshots on. New monitors capture screenshots by default, and you should leave that on for data releases. A timestamped image of the release page is your evidence record of exactly what the agency published and when, which matters if a figure is later corrected or you need to reconstruct a trade decision.
Step 6: Add thresholds and conditional rules. Use number tracking with a threshold so you only get paged when a value moves by an amount that matters, and a direction filter so a cooling inflation print and an accelerating one can trigger different routes. This is where conditional alert rules on price, keyword, and threshold conditions turn a raw page-change feed into a tuned signal.
Can PageCrawl pull the exact figure from the BLS or BEA API?
Yes. Both BLS and BEA publish structured data APIs that return the series values as JSON, and JSON/API field tracking lets you monitor one specific field rather than scraping prose off the HTML release. Point a monitor at the API endpoint for, say, the CPI series or the PCE price index, and track the single value you care about.
This is often the cleanest setup for a precise figure. Instead of parsing the headline out of a paragraph, you watch the numeric field directly and get a clean before-and-after value. PageCrawl supports JSON and API field tracking with JSONPath and jq-style filters, so you can isolate the exact element in the response, such as the latest period's value, and ignore the rest of the payload.
A common pattern is to run two monitors per release: one fullpage content monitor on the human-readable release page, and one JSON field monitor on the corresponding API series for a precise, machine-clean number. The HTML monitor gives you the story and a screenshot; the API monitor gives you a value you can drop straight into a spreadsheet or model. Note that API series sometimes update slightly after the headline release, so the page monitor usually fires first.
How do you keep economic data alerts signal-heavy and avoid noise?
The trick is to separate the rare moments that matter from the constant cosmetic churn on a busy government page. Agency pages update navigation, related-links blocks, and boilerplate far more often than they post a new figure, so a naive fullpage monitor can page you for nothing. Scope each monitor tightly and gate it on a real numeric move.
A few concrete practices keep the noise down:
- Scope to the figure, not the whole page. Use keyword/text tracking or number tracking aimed at the section holding the headline value, so footer and sidebar edits never trigger an alert.
- Set a numeric threshold. With number tracking, require a move of at least a meaningful amount before alerting. A change of 0.0 to a final-digit rounding artifact should not wake the desk.
- Use direction filters. Split accelerating and decelerating prints into separate alert routes so the on-call person can see at a glance which way a figure broke.
- Run a separate revision watcher. Keep one monitor whose job is to catch restatements of prior months, since those arrive on a different rhythm than fresh headlines.
Tuning thresholds is the same discipline that keeps any monitoring program useful rather than ignored, and the broader playbook in our guide on how to monitor website changes without drowning in noise applies directly. A data-release feed that pages only on genuine moves is one a trader will actually trust at 8:30 in the morning.
Who relies on fast economic data monitoring?
Macro traders, rates and FX desks, sell-side and buy-side economists, corporate treasury teams, and financial journalists all build their morning around these prints. Anyone whose decisions depend on inflation, employment, or growth data needs the figure as soon as it is on the agency page and needs to know when a prior number is revised.
For a trading desk, the use case is speed: detect the print, route the value to a model or chat channel, and react before the move is fully priced. For an economist, the value is completeness: catching every revision and schedule shift so a forecast is never built on a stale figure. For a treasury team, it is context: knowing as soon as a PCE or CPI surprise lands so hedging decisions can be revisited the same morning. Whatever the desk, confirm any figure against the official BLS or BEA release before acting on it; this article is informational and not investment advice.
Economic data sits alongside a wider set of market-moving disclosures such as SEC filings, IR pages and earnings releases that reward fast detection. Teams that monitor data releases also watch SEC filings as they hit the EDGAR system and credit rating actions from the major agencies, because the same advantage applies everywhere: the event is scheduled or sudden, the source page is canonical, and being first to see it is worth real money.
Choosing your PageCrawl plan
PageCrawl's Free plan lets you monitor 6 pages with 220 checks per month, which is enough to validate the approach on your most critical pages. Most teams graduate to a paid plan once they see the value.
| Plan | Price | Pages | Checks / month | Frequency |
|---|---|---|---|---|
| Free | $0 | 6 | 220 | every 60 min |
| Standard | $8/mo or $80/yr | 100 | 15,000 | every 15 min |
| Enterprise | $30/mo or $300/yr | 500 | 100,000 | every 5 min |
| Ultimate | $99/mo or $999/yr | 1,000 | 100,000 | every 2 min |
Annual billing saves two months across every paid tier. Enterprise and Ultimate scale up to 100x if you need thousands of pages or multi-team access.
For economic data, frequency is the variable that matters most. The tighter check cadence on Enterprise and Ultimate is what lets you detect an 8:30 a.m. print within the first checking interval after it publishes, which is the difference between trading on the number and reading about it.
How should you start monitoring economic data releases?
Start with the single release that matters most to you. Add that agency page to a free PageCrawl account, point a monitor at the 8:30 a.m. ET window with screenshots on, and route the alert to Slack or a webhook.
The next CPI, jobs report, and PCE releases are already on the calendar. The only question is whether you see them on your next scheduled check or long after the market has moved. By the next print you will already be faster than a desk refreshing tabs.