On a Tuesday morning at 9:14 a.m., a procurement lead at a Fortune 500 insurer replied to a sales rep with one line: "Your deck says Leader, but the new Magic Quadrant published last week shows you in the Challengers box." The rep, who worked at a mid-market security vendor, had been pitching a six-figure deal off a slide that cited "2024 Gartner Magic Quadrant Leader." The refreshed edition had dropped nine days earlier. Nobody on the product marketing team noticed, because the licensed reprint URL on the vendor's own site quietly swapped the old graphic for the new one. By the time anyone looked, three reps were presenting an out-of-date position to live pipeline.
Analyst placements are some of the highest-leverage facts in B2B buying. A move from Leader to Challenger in a Gartner Magic Quadrant, or from Strong Performer to Leader in a Forrester Wave, reshapes shortlists, RFP scoring, and board narratives. Yet these reports refresh on annual or semi-annual cycles with no warning, and the public surfaces where they appear (press releases, vendor reprint pages, analyst summary pages) change silently. The vendor that gets the alert first updates its messaging, briefs sales, and capitalizes. The vendor that finds out from a prospect loses the room.
This guide covers what to monitor across Gartner, Forrester, IDC, and G2, how to detect a position change the day it happens, and how to capture the quadrant graphic as dated evidence.
What does analyst report position monitoring actually track?
Analyst report position monitoring watches the public web pages where research firms publish vendor placements, then alerts you when a check detects a new edition or a vendor shifting between tiers. It tracks four things: the existence of a new report, the named position of each vendor, the visual graphic itself, and any reprint or press page that hosts the result.
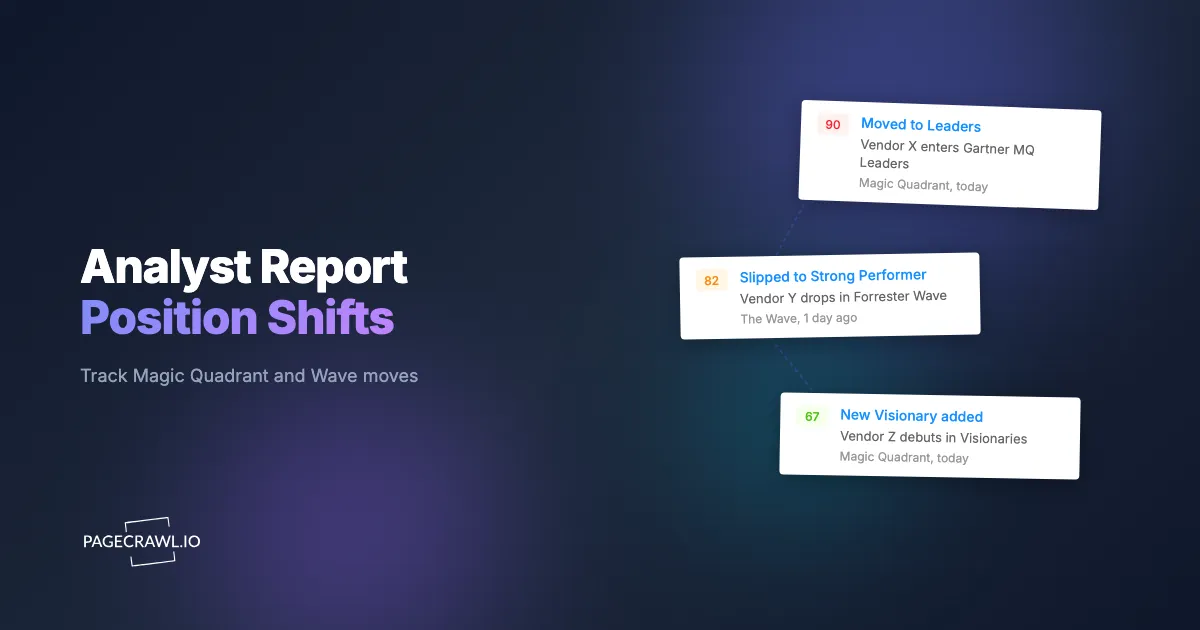
The placements that matter are named tiers in named frameworks. Gartner Magic Quadrants sort vendors into Leaders, Challengers, Visionaries, and Niche Players based on two axes: completeness of vision and ability to execute. Forrester Waves rank vendors as Leaders, Strong Performers, Contenders, and Challengers across current offering, strategy, and market presence. IDC MarketScape uses Leaders, Major Players, Contenders, and Participants. G2 Grid reports group software into Leaders, High Performers, Contenders, and Niche based on satisfaction and market presence scores.
Because these are recurring, scheduled documents, the smart approach is continuous monitoring, not a one-time check. You are watching for two events: a brand new edition being published, and a position change within an edition (a vendor moves, a new entrant appears, or a competitor gets dropped). Both deserve a same-day alert, and both are easy to miss manually when reports land on any random weekday. This is exactly the recurring, high-intent signal a structured competitive intelligence strategy and program should automate rather than leave to chance.
Why do Magic Quadrant and Forrester Wave changes matter so much?
These reports matter because enterprise buyers use them as a shortcut for trust. A large share of enterprise software RFPs explicitly require or reward a Leader or Strong Performer placement, and procurement teams routinely filter vendors out of consideration if they fall outside the top tier. A single tier movement can swing whether you make a shortlist at all.
The downstream effects compound fast:
- Sales decks and battlecards go stale instantly. The moment a new edition publishes, every slide citing the old position is wrong, and reps presenting an outdated quadrant lose credibility fast.
- Competitor messaging shifts within hours. When a rival jumps to Leader, their homepage, paid ads, and email campaigns light up with the news. Catching it the same day lets you prepare counter-messaging instead of scrambling a week later. Pairing analyst monitoring with broader competitor content intelligence gives you both the placement and the spin around it.
- Board and investor narratives depend on it. "We are a Gartner Magic Quadrant Leader for the third consecutive year" is a board-deck staple. If that streak breaks, leadership needs to know before the board meeting, not during it.
- Analyst relations teams need lead time. If you slip a tier, your AR team wants to engage the analyst, understand the rationale, and plan the response before the market reacts.
The cost of being last to know is measured in lost deals and reactive scrambling. The cost of monitoring is one configured alert.
Which pages should you monitor for analyst placements?
Monitor four categories of public page: official analyst summary or press pages, vendor-hosted licensed reprint pages, vendor newsroom press releases, and review-platform grid pages like G2. Each surface updates on its own schedule, so tracking several in parallel catches the change wherever it appears first, which is often a competitor's press release before the analyst's own page and exactly the kind of signal competitive intelligence monitoring exists to surface.
Vendor reprint and "complimentary copy" pages
Research firms license vendors to host a reprint of the report, usually behind a short form or as a gated PDF. These reprint pages (often carrying a Gartner reprint identifier in the URL) are the single richest surface to watch, because vendors swap them the day a new edition is approved. When a competitor's reprint page changes its report year or graphic, you have caught the new edition at the earliest public moment. Many are PDFs, so PDF monitoring matters as much as HTML monitoring.
Analyst press and summary pages
Gartner, Forrester, and IDC publish press releases and short public summaries announcing major report cycles. These are stable URLs that update predictably each cycle. Watching them confirms the official publication date, which you will want for any dated evidence you cite externally.
Competitor newsrooms and homepages
The fastest signal is often a competitor's own celebration. Vendors push "Named a Leader" announcements to their newsroom and homepage within hours of a favorable result. Tracking those pages alongside the analyst sources, much like you would when you monitor competitor websites programmatically, means you rarely wait on the analyst firm to update first.
G2 Grid and review-driven reports
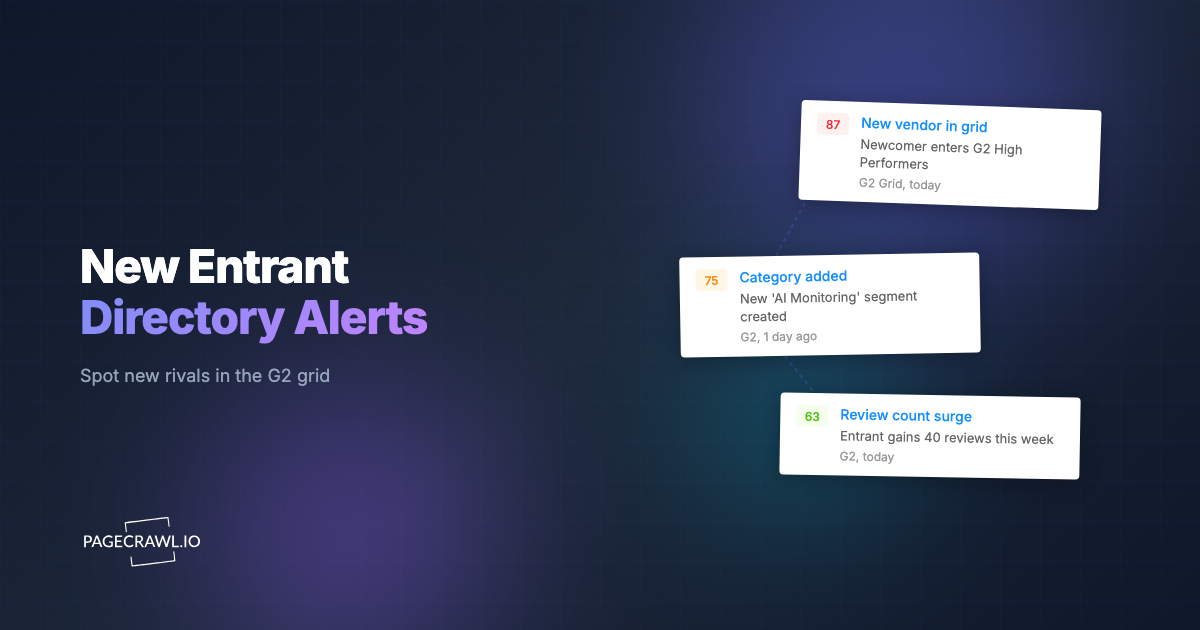
G2 Grid reports refresh quarterly and are driven by review volume and satisfaction scores, which makes them more dynamic than the annual analyst cycles. The Grid placement and category leader badges change on the public category pages. If you already monitor your G2 reviews and software comparison pages, adding the Grid position itself captures the headline result, not just the underlying reviews.
How do you detect when a vendor moves between Leader, Challenger, Visionary, and Niche?
You detect tier movement by combining two tracking modes: keyword/text tracking on the labeled position text, and visual change capture on the quadrant or wave graphic. Text tracking fires when the words around a vendor name change (for example "Leaders" becomes "Challengers"), while visual capture flags any movement in the plotted dot even when the surrounding text stays the same.
Most analyst pages present the result in two forms: prose that names each tier and the vendors in it, and a graphic that plots vendors as dots on the axes. Each form needs its own detection method.
Region diff for the labeled position
Many reprint and summary pages list vendors by tier in text, or include a caption that names a vendor and its tier, such as "[vendor] positioned as a Leader." Use keyword/text tracking scoped to that region of the page so the alert fires on the exact phrase that matters and ignores unrelated edits elsewhere (navigation, footers, cookie banners). Region-scoped tracking keeps the signal tight: you are watching the sentence that names the tier, not the whole document.
Visual change capture for the graphic
The quadrant itself is an image, and a vendor can move a meaningful distance on the axes without any text changing. Visual change capture screenshots the graphic on every check, then flags pixel-level differences between the current and previous capture. When a dot crosses from the Challengers quadrant into Leaders, the visual diff highlights it even if the page caption is generic. New monitors keep screenshots on by default, so every check stores a dated image automatically.
Detecting new entrants and dropped vendors
Tier movement is not the only event. A new competitor appearing on the quadrant, or an incumbent being dropped, matters just as much. Fullpage content tracking captures the complete list of plotted vendors, so when the roster grows or shrinks you get notified. Layering a keyword and threshold based conditional alert lets you escalate only when a specific competitor name appears or disappears, not on every minor caption edit.
How do you capture the quadrant graphic as dated evidence for sales decks?
PageCrawl captures a full-page screenshot on every check and timestamps it, so each time a report page changes you automatically hold a dated, before-and-after image of the quadrant or wave. That dated capture makes your sales claim defensible: you can show the exact graphic as it appeared on a specific date, sourced from the public page, and signed web archives with timestamped evidence back it up when the claim has to hold outside your own team.
This matters for three reasons. First, analyst firms have strict citation rules, so pointing to the precise edition and date keeps your marketing claims accurate. Second, when a competitor claims a placement, a dated capture lets you verify whether they are citing the current edition or quietly reusing an older, more favorable one. Third, the timeline of captures records how your position and your competitors' moved across editions, which is gold for board decks and win/loss analysis.
The visual history works like the dated evidence approach used for visual evidence in domain disputes: every capture is stored with its timestamp, so you can prove what a public page showed at a given moment. For analyst reports, that means a side-by-side of last year's quadrant and this year's, pulled straight from your monitor history into a battlecard in minutes.
What about G2 Grid, IDC MarketScape, and Gartner Peer Insights?
The same monitoring pattern covers every major framework, you just point it at different surfaces. G2 Grid placements live on public category pages and refresh quarterly, IDC MarketScape results appear on vendor reprint and press pages, and Gartner Peer Insights publishes customer-choice distinctions on dedicated pages. All four are public, all four refresh on a schedule.
G2 Grid and category leaders
G2 Grid reports are review-driven, so they move more often than annual analyst reports. The public category page shows the Grid graphic and badges like "Leader" and "High Performer" each quarter. Some G2 data is also exposed as structured fields, so JSON/API field tracking can watch a specific score or rank value and alert on a numeric threshold, complementing the visual capture of the Grid itself.
IDC MarketScape
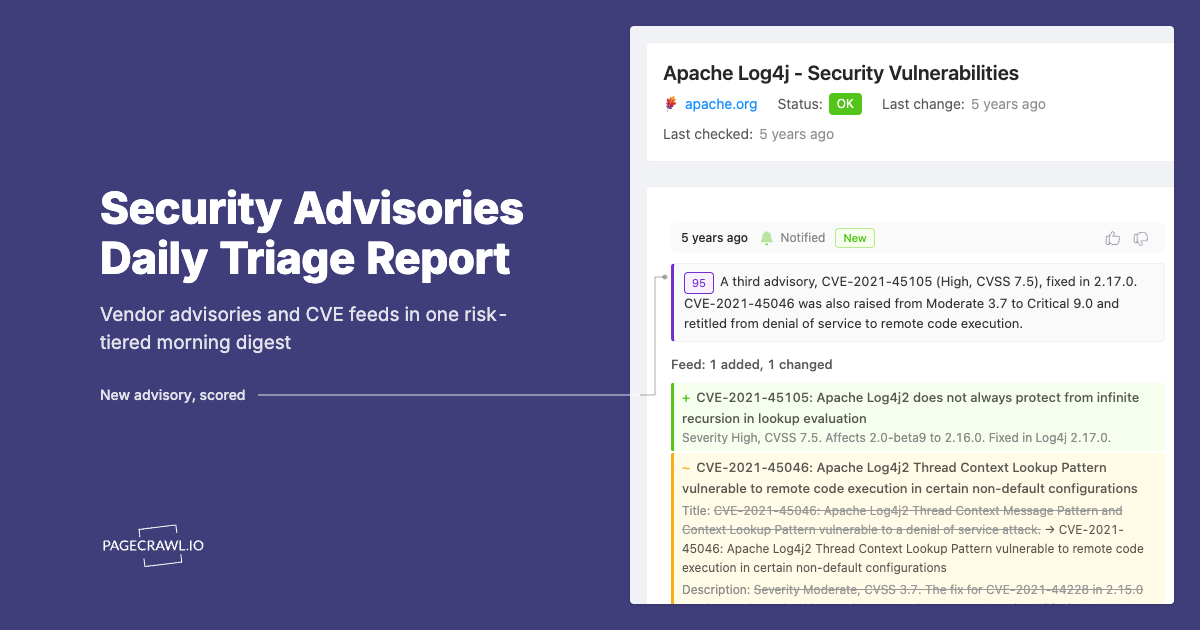
IDC MarketScape results commonly surface first on vendor reprint pages and press releases. Treat them like Magic Quadrant reprints: visual capture on the graphic, keyword tracking on the tier text (Leaders, Major Players, Contenders, Participants), and PDF monitoring for downloadable reprints.
Gartner Peer Insights and recognition pages
Peer Insights "Customers' Choice" and similar recognition pages update on their own cadence and are worth a separate monitor, since a customer-choice distinction is a different sales claim than an analyst quadrant placement. Watching analyst surfaces alongside review velocity gives you the full picture, the kind of layered view a complete competitive marketing intelligence program is built on.
How do you set up analyst report monitoring with PageCrawl?
Setting up analyst report monitoring takes about ten minutes per source. The goal is one monitor per page you care about (your own reprint, two or three competitor reprints, the analyst press page, and the relevant G2 category page), each configured to catch both a new edition and a tier movement. Here is the exact setup.
Step 1: Add the page and choose the right tracking mode. Paste the URL of the reprint, press, or Grid page into PageCrawl. For the quadrant or wave graphic, choose visual change capture so the screenshot is compared on every check. For pages that name positions in text, add keyword/text tracking scoped to the region containing the vendor and tier. For gated or downloadable reports, enable monitoring changes in PDF files so the document content itself is diffed. If a page exposes structured data, use JSON/API field tracking to watch a specific score or rank.
Step 2: Scope the region to cut noise. Analyst and vendor pages carry navigation, promos, and cookie banners that change constantly. Use region-based selection so the monitor watches only the quadrant graphic and the paragraph that names the tiers. This keeps alerts tied to real position changes instead of unrelated edits.
Step 3: Set the check frequency. Analyst reports refresh on long cycles but land without warning, so a steady cadence matters more than high frequency. On a paid plan, checking every 15 minutes means you learn about a new edition within minutes of it going live, typically faster than the analyst firm updates its own summary page.
Step 4: Choose your notification channel. Route alerts to where your competitive and AR teams already work. Send a website change alert to Slack so product marketing sees the new edition as soon as a check detects it, or use Telegram, Discord, email, or a webhook. For automated workflows, a webhook can trigger your downstream automation to refresh battlecards or notify the AR lead automatically.
Step 5: Confirm screenshots are on. New monitors keep screenshots enabled by default, which is exactly what you want here. Every check stores a dated capture of the quadrant or wave, building the visual history you will pull into sales decks. Leave this on so you never have to reconstruct what a page showed last quarter.
Step 6: Set thresholds and conditions. For numeric signals like a G2 satisfaction score, add a threshold so you only get alerted on a meaningful move, and set a direction (for example, alert when a competitor's score crosses above yours). For text and visual monitors, layer a keyword rule from notification conditions and filters so an alert escalates when a specific competitor name shifts tier or a new entrant appears, keeping routine page edits quiet.
Once configured, the monitor runs continuously. When the next edition publishes or a vendor moves, you get an alert with a before-and-after view and a fresh dated screenshot in your history, ready for the highest-stakes pages in your category.
How often should you check, and how do you avoid false alarms?
Check often enough to catch a publication the day it happens (every 15 minutes on a paid plan is the sweet spot), but lean on region scoping and conditions to keep alerts meaningful. The risk with analyst pages is not missing the change, it is drowning in noise from unrelated edits.
Three practices keep the signal clean. First, scope every monitor to the region that holds the graphic and the tier text, never the whole page, so navigation and promo banners cannot trigger alerts. Second, use keyword conditions so a tier-word change (Leader to Challenger) or a named competitor appearing is what escalates, while cosmetic edits stay silent. Third, separate your monitors by event type: one watching the visual graphic for dot movement, another watching the text for tier names, so each alert tells you precisely what changed.
Because analyst reports refresh on predictable seasonal cycles, you can also raise attention during known windows. Many Magic Quadrants and Waves cluster in specific quarters, so when your category's typical publication month approaches, that is when the monitor earns its keep. The rest of the year it sits quietly, and the day the new edition lands, you are first to know. That is the whole point: a once-a-year surprise becomes a routine, automated signal, and analyst placements are the single most quotable fact in your market.
Choosing your PageCrawl plan
PageCrawl's Free plan lets you monitor 6 pages with 220 checks per month, which is enough to validate the approach on your most critical pages. Most teams graduate to a paid plan once they see the value.
| Plan | Price | Pages | Checks / month | Frequency |
|---|---|---|---|---|
| Free | $0 | 6 | 220 | every 60 min |
| Standard | $8/mo or $80/yr | 100 | 15,000 | every 15 min |
| Enterprise | $30/mo or $300/yr | 500 | 100,000 | every 5 min |
| Ultimate | $99/mo or $999/yr | 1,000 | 100,000 | every 2 min |
Annual billing saves two months across every paid tier.
Enterprise and Ultimate scale to thousands of pages and multi-team access.
How do you start monitoring analyst reports today?
Pick the three pages that would hurt most to miss (your own reprint, your top competitor's reprint, and your category's G2 Grid page), add them to PageCrawl with visual capture and region-scoped text tracking, and route the alert to Slack. The next time a Magic Quadrant or Forrester Wave moves, you hear it from your monitor first.
That means the alert reaches you at 9:00 a.m., not from a prospect at 9:14. Set it up today, and never present an out-of-date position again.