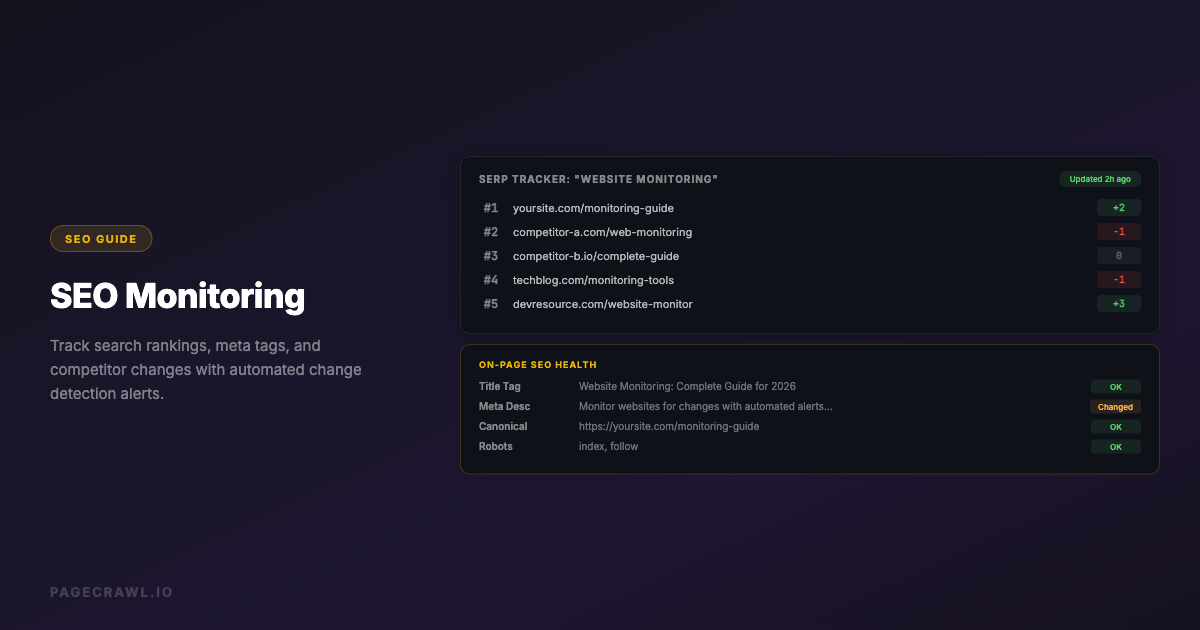

An SEO lead opens the rank tracker on Monday morning and the dashboard is green. The primary money keyword sits at average position 3, up from 3.4 last month. The team Slack gets a thumbs-up. Then the analytics tab loads: organic clicks to that page are down 22 percent quarter over quarter, and conversions from search have flattened. The number says you are winning. The traffic says you are losing. Both are reading the same keyword.
This is not a tracking bug. It is the predictable result of measuring a single averaged number on a search results page that no longer looks the same for any two people. "Average position 3" used to mean roughly the third blue link, near the top, where most clicks land. Today position 3 can sit below an AI Overview, a featured snippet, a pack of product listings, a "People also ask" accordion, and a video carousel, all of which absorb attention and clicks before a human ever reaches your result. The rank held. The visibility collapsed. Your tracker reported the rank.
This guide explains why average position lies, what it is actually measuring under the hood, and which signals reflect real visibility instead. Then it walks through a concrete setup for monitoring the live search results page and your own landing pages, so you see the changes that move traffic rather than the changes that move a vanity metric.
Why does average rank position lie?
Average position lies because it compresses thousands of different, personalized, feature-cluttered search results pages into one number, then strips away the layout context that decides whether anyone actually sees you. A result can hold position 3 while losing most of its visibility to features that rank "above" it visually but not numerically. The rank is stable; the experience is not.
Five forces pull the reported number away from reality, and most rank trackers account for none of them well.
Personalization means there is no single ranking
Two people searching the same phrase at the same second get different results. Search engines factor in past behavior, logged-in account signals, search history, and engagement patterns, as Google describes in How Search Works. Your result might appear at position 2 for a returning visitor who clicked you last week and position 7 for a first-time searcher with no history. A rank tracker reports one figure, usually from a clean, history-free probe, which matches almost nobody's real experience. The "average" is an average of a distribution your tracker never fully samples.
Localization shifts the entire page by ZIP code
Location reorders results more aggressively than almost any other factor, especially for anything with commercial or local intent. A query that returns a local pack, a map, and nearby businesses in one city returns a completely different set 50 miles away. If your tracker checks from a single data-center location, it reports a ranking that exists only for that one point on the map. For businesses with physical locations or regional service areas, this gap is enormous. Tracking the live results page and your own Google Business Profile and local listing changes catches the localized reality a national average erases.
SERP features push organic results below the fold
Even when your blue-link position is unchanged, the page above it can grow. A featured snippet, a "People also ask" block, image and video carousels, shopping units, and sitelinks all consume vertical space. Position 3 on a clean page is near the top. Position 3 on a feature-heavy page can be three full screens down on a phone. Your rank number did not move. Your pixels from the top of the page doubled, and your click-through rate fell off a cliff. This is the single most common way a tracker reports stability while traffic erodes.
AI Overviews and zero-click answer the query for you
When a generated AI Overview sits at the top of the results, it summarizes the answer inline and cites a handful of sources. Many searchers read the summary and never scroll. Your position 3 link is now competing for the residual clicks of people who were not satisfied by an answer that appeared before your result loaded. You can rank well and still lose the click, because the click stopped happening. Whether your brand is even named in those AI answers is its own monitoring problem worth tracking, covered in our guide to monitoring your brand in AI search results.
Device and intent reshape the same query
Mobile results stack vertically and show fewer items before the fold than desktop. Intent shifts the layout too: a query the engine reads as transactional gets shopping units and ads, while an informational read of the same words gets a snippet and articles. A single averaged position blends desktop and mobile, informational and transactional, into one figure that describes no actual screen a user looked at.
What is average position actually measuring?
Average position in Search Console is the mean ranking of your page across every impression it received, where an impression counts whether or not the result was visible without scrolling. It is a backward-looking aggregate of where you appeared, weighted by how often each query fired, not a measure of how prominent or clickable you were on any individual page.
That definition has three consequences worth internalizing. First, it is volume-weighted, so a flood of impressions on a long-tail variant where you rank well can drag your "average" up even as your head term slips. Second, it counts an impression at position 8 the same as one at position 2 for the purpose of the average, with no adjustment for the features stacked above either. Third, it is computed after the fact, so by the time a decline shows up in the report, the layout change or competitor move that caused it happened days or weeks earlier. The metric is real and useful for trend direction, but it is the wrong tool for answering "what does my result look like right now, and did something just change?" For that, you have to look at the page itself. Pairing Search Console trends with live SEO monitoring of the actual results page closes that gap.
What should you track instead of average position?
Track the things that determine whether a real person sees and clicks you: your pixel position from the top of the page, which SERP features occupy the space above you, whether you own or lost a feature like the snippet or local pack, the presence and content of an AI Overview, and the actual click-through rate the position earns. These describe visibility; average position only describes ordinal rank.
Here is the practical hierarchy, from most to least honest about real visibility.
- Pixel position and above-the-fold presence. How far down the page is your result after all features load, on both mobile and desktop? This is the number that correlates with clicks, and it can change while your ordinal rank does not.
- SERP feature ownership. Do you hold the featured snippet, sitelinks, an image pack slot, or a local pack listing? Winning or losing a feature swings click share far more than moving one ordinal place. Featured snippets in particular can capture a large share of the clicks on a query, and Google Search Central documents how each feature is generated and how to influence it.
- AI Overview presence and citations. Is there a generated answer on this query, and are you cited inside it? An Overview appearing where there was none last week can quietly halve your clicks at an unchanged rank.
- Competitor movement on the page. Did a competitor newly capture the snippet, add sitelinks, or launch a result above you? Watching rivals directly, as covered in how to track competitor websites, explains traffic shifts a solo rank number cannot.
- Click-through rate at a fixed position. If your position is flat but CTR is falling, the page above you changed even if your line in it did not. CTR decay at a stable rank is the fingerprint of a feature or AI Overview eating your clicks.
How does monitoring the real SERP reveal visibility shifts?
Monitoring the actual search results page reveals visibility shifts because it captures the full layout a user sees, not a single ordinal number. When the page itself is tracked for changes, a new AI Overview, a competitor's freshly won snippet, a shopping unit that pushed you below the fold, or an algorithm-driven reshuffle all surface as detectable changes with timestamps and screenshots.
The difference is between measuring your line in a document and photographing the whole page. A rank tracker tells you "you are line 3." Page monitoring of the live results tells you "line 3 now sits under a four-source AI Overview and a snippet your competitor won on Tuesday." The second description is the one that explains your traffic. By watching the results page as a page that changes over time, you get an evidence trail: the exact day the layout shifted, a screenshot of the before and after, and an alert on the next check that catches it rather than weeks later in an aggregate report. This is the same change-detection discipline teams already apply to product pages and pricing, pointed at the surface that feeds your organic traffic. When a broad reshuffle hits many queries at once, correlating it with Google algorithm update and search status monitoring tells you whether the cause was you or the whole index.
How do AI Overviews and zero-click change what you measure?
AI Overviews and zero-click search change the measurement because the click you were optimizing for increasingly does not happen, which makes ordinal rank a measure of a prize that is shrinking. When a generated answer resolves the query inline, ranking first below it can still mean fewer visits than ranking third did a year ago. You have to measure presence in the answer, not just position beneath it.
Practically, this means adding two questions to your tracking that a rank number cannot answer. One: does this query now trigger an AI Overview where it did not before, and did my organic clicks drop the same week? Watching the results page for the appearance and content of that block turns an invisible cause into a dated, screenshotted event. Two: when the Overview cites sources, is my domain among them, and what does it say about my brand? Citation inside the answer is the new top spot, and it is monitored by watching the answer surfaces directly, the same ground covered by brand monitoring across review sites and AI search results. Treating the AI layer as content that changes, rather than as a fixed feature, is what keeps you from optimizing toward a click that the page already absorbed.
How to set up SERP and page monitoring with PageCrawl
You set this up by monitoring two surfaces in parallel: the live search results pages for your priority keywords, and your own ranking landing pages. PageCrawl captures each as a page that changes over time, screenshots every check, and alerts you when the layout, features, or content move. The free tier covers 6 monitors and 220 checks per month, enough to instrument your most important queries before scaling.

Step 1: Pick your priority queries and pages. List the 6 to 10 keywords that drive the most revenue or pipeline, plus the landing pages that rank for them. Start narrow. Your highest-intent commercial queries are where feature creep and AI Overviews hurt the most, so they earn the first monitors.
Step 2: Add the live results pages as monitors. For each priority keyword, add the search results URL for that query as a monitor. PageCrawl treats the whole page as the tracked surface, so any structural change (a new AI Overview, an added shopping unit, a competitor winning the snippet) registers as a detected change with a timestamped screenshot. Enable screenshots so every check leaves visual evidence of exactly what the page looked like that day.
Step 3: Add your own landing pages as monitors. Track the pages that rank with SEO monitoring on meta tags and page content, so you catch your own regressions: a title or meta change a teammate shipped, a template update that dropped your schema markup, or content edits that altered the snippet you were winning. Pairing this with backlink monitoring covers both on-page and off-page causes of a ranking move.
Step 4: Narrow the focus with element tracking. Instead of treating the entire page as one blob, target what matters, using the approach in the guide to monitoring multiple elements on a page. Use keyword monitoring to fire when specific terms (your brand name, a competitor, "AI Overview") appear or vanish on the results page. This cuts noise from the constantly shuffling ads and unrelated modules.
Step 5: Set conditional alerts. You do not want a ping for every pixel shift. Configure conditional alerts with notification conditions and filters so you hear only about a meaningful trigger, for example when an AI Overview block first appears, when your brand drops out of the cited sources, or when a competitor's domain shows up in the top features.
Step 6: Route alerts where the team works. Send notifications to the channel your SEO and content teams actually watch. Slack alerts put the screenshot and the diff in front of the people who can react the same day, instead of waiting for the monthly report.
Step 7: Set a sensible check frequency. For high-stakes commercial queries, check several times a day so you catch a feature change within hours. For stable informational pages, daily is plenty. More frequent checks shrink the window between a layout shift and your awareness of it.
Step 8: Review the timeline weekly. Once a week, scan the change history across your monitored queries. The screenshot trail turns "traffic dipped, not sure why" into "on the 14th an AI Overview appeared on three of our money queries," which is an answer you can act on. This same discipline underpins broader SEO monitoring programs.
Choosing your PageCrawl plan
PageCrawl's Free plan lets you monitor 6 pages with 220 checks per month, which is enough to instrument your top queries and prove that page-level SERP monitoring explains traffic moves your rank tracker misses. Most teams graduate to a paid plan once they want to cover a full keyword set.
| Plan | Price | Pages | Checks / month | Frequency |
|---|---|---|---|---|
| Free | $0 | 6 | 220 | every 60 min |
| Standard | $8/mo or $80/yr | 100 | 15,000 | every 15 min |
| Enterprise | $30/mo or $300/yr | 500 | 100,000 | every 5 min |
| Ultimate | $99/mo or $999/yr | 1,000 | 100,000 | every 2 min |
Annual billing saves two months across every paid tier. Enterprise and Ultimate scale up to 100x if you need thousands of pages or multi-team access.
For most SEO teams, Standard at $80 per year is the natural home: 100 monitors comfortably cover a primary keyword set plus the landing pages that rank for them, with 15-minute checks fast enough to catch a feature change the same morning it appears. Agencies and in-house teams tracking many markets, localized variants, or large content libraries move to Enterprise, where 500 monitors handle multi-region results pages and the volume of queries a serious program watches. The point is consistency: a visibility signal you check once a quarter is not a signal, it is a postmortem.
Getting Started
Average position will keep telling you that everything is fine right up until the traffic proves it is not. Stop measuring your line and start watching the whole page. Pick your five highest-intent queries, add the live results pages and your landing pages, turn on screenshots, and route the alerts to Slack. Create a free account, instrument those queries today, and within a week you will see the layout changes that move clicks long before they show up in any report.
Rank is what your tracker sees. Visibility is what your customer sees. Monitor the page, and stop confusing the two.