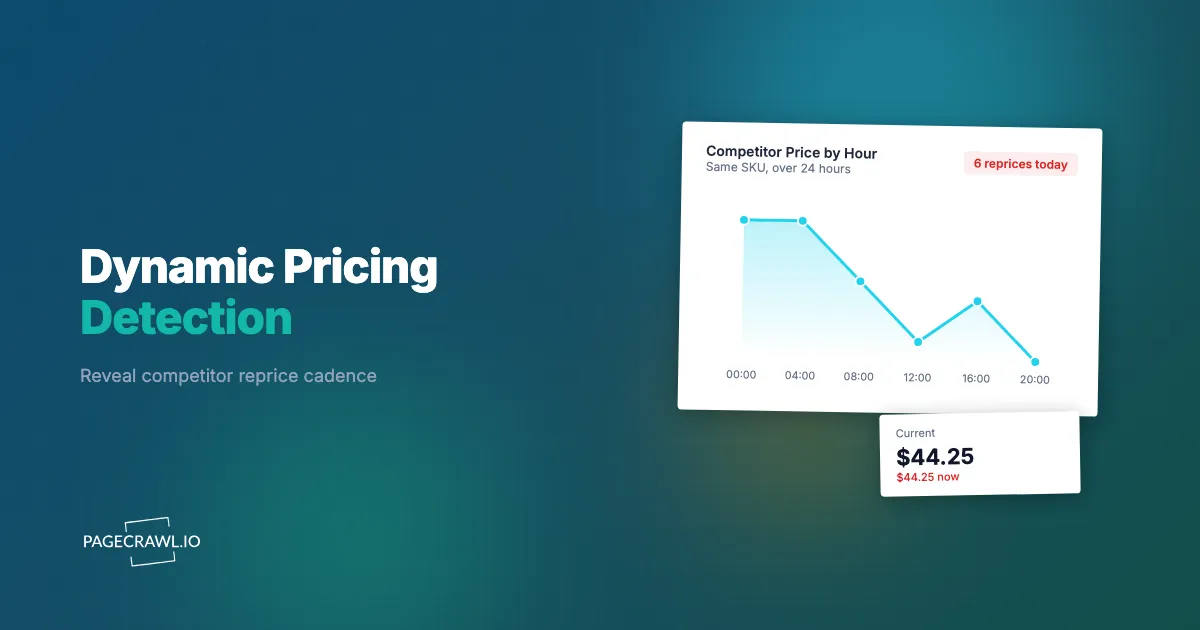
At 2:14 p.m. on a Tuesday in March, you cut the price of your best-selling cordless drill by $4 to grab the Buy Box. You felt clever for about seventeen minutes. By 2:31 p.m. your largest rival had matched you to the cent, and by 4:00 p.m. they were a dollar under. You never watched the move happen. You only noticed the next morning, when your conversion rate had quietly slumped and the margin you fought for had evaporated. The number on their product page looked static all along. The behavior behind it was anything but.
This is the core problem with algorithmic pricing. When you open a competitor's page, you see one number. That number is a single frame of a moving picture, and the picture is the part that matters. A rival running automated repricing might change a price thirty times a day, react to your moves within minutes, and quietly reset every morning at 6 a.m. None of that is visible in a snapshot. It only appears when you capture the price again and again and line up the timeline.
Most price-tracking advice tells you to watch the current number and react when it drops. That is useful, but it treats the symptom, not the system. To beat a competitor who reprices algorithmically, you have to see the algorithm: its cadence, its triggers, and its blind spots. This guide shows how to expose dynamic pricing behavior from change-history cadence, read the repricing timeline, choose a check frequency, and set it up in PageCrawl so each undercut reaches you as soon as a check detects it.
What is dynamic (algorithmic) pricing, and why can't you see it?
Dynamic pricing is software that adjusts a product's price automatically based on rules and live competitor data, sometimes changing it dozens of times a day. You cannot see it by glancing at the page, because the current number is one frame of a moving picture. The behavior only emerges in the sequence of changes captured over time.
Retailers run repricers for the same reason airlines and rideshare apps do: a static price leaves money on the table. An algorithmic repricer ingests inputs (your price, the lowest market price, stock levels, time of day, demand) and outputs a new price on a schedule that can be every few minutes. Some are simple "beat the lowest competitor by one cent" rules. Others optimize for margin, velocity, or Buy Box ownership using far more variables. Regulators have noticed the practice as well: the US Federal Trade Commission has been examining how retailers use consumer data to set prices.
The practical consequence for you is that the price field is deceptive. A competitor whose page reads $43.97 right now might have read $46.50 at 9 a.m. and $42.10 at noon. If you check once a day, you record one of those values at random and conclude their pricing is stable. It is not stable; it is constantly moving, and you are sampling far below the signal. Catching dynamic pricing is fundamentally a sampling problem, and the fix is to sample fast and log everything.
How can you tell whether a competitor is repricing algorithmically or by hand?
Manual price changes are rare, rounded, and clustered around business hours. Algorithmic repricing is frequent, precise to the cent, and active overnight and on weekends. If a rival's price moves three times before lunch, lands on values like $43.97 or $51.43, and shifts at 3 a.m. on a Sunday, you are watching a machine, not a merchant editing a spreadsheet.
Once you have a few days of logged history, look for these tells:
- Frequency. A human changes a price a handful of times per month. A repricer changes it multiple times per day, sometimes per hour. High frequency is the single clearest signal.
- Odd cent values. Manual prices favor round and charm endings (
$49.99,$50.00). Algorithms that beat a competitor by a fixed delta produce ugly numbers like$48.62because they are derived from someone else's price minus a cent. - Off-hours activity. Price changes at 2 a.m., on weekends, and on public holidays mean no person is involved. Schedulers do not take Sundays off.
- Symmetric reversions. The price drops to undercut, then climbs back once the trigger clears. Manual changes rarely bounce back to the exact prior value.
- Tight reaction to your moves. If your change at 2:14 is followed by theirs at 2:31, that latency is the repricer's polling interval, not a coincidence.
Gathering this evidence means keeping a clean change log, which is exactly what a competitor price monitoring setup for ecommerce produces. The difference here: you read the log for rhythm, not just the latest number.
What does a repricing cadence look like in change history?
A repricing cadence is the rhythm of price changes in a timeline: how often the price moves, at what times of day, and by how much. In change history it appears as a dense column of timestamped entries against one SKU. Reading that column reveals whether the algorithm runs hourly, chases your moves, or resets each morning.

When you track a single rival SKU with frequent checks, PageCrawl records every detected change as a dated entry with the old value, the new value, and the exact time. Stacked up over a week, that history becomes a behavioral signature. Three patterns recur often enough to name.
The fixed-interval reset
The price holds steady all day, then snaps to a new baseline at a consistent time (often early morning). This is a batch repricer that recalculates once or twice a day. Your countermove is timing: change your own price just after their reset so they cannot react until the next cycle.
The continuous chaser
The price moves many small steps throughout the day, each one tracking the lowest available competitor. The cadence is irregular but dense, and the deltas are small (a cent to a few cents). This repricer is reactive and fast, so a price war with it is unwinnable on price alone. Compete on shipping, bundling, or landed price including the free-shipping threshold instead.
The demand-curve climber
The price ratchets up during predictable demand windows (weekday evenings, weekend mornings, the run-up to a holiday) and relaxes afterward. The cadence correlates with the clock and the calendar, not with you. Here the insight is that they are leaving margin on the table during off-peak hours, which is your opening.
Reading these patterns is the heart of competitive pricing analysis. The cadence tells you which game you are actually playing, and it is exactly the signal a broader competitive intelligence program is built to surface.
Which triggers does the price timeline reveal?
A well-logged price timeline exposes the inputs the algorithm reacts to: your price moves, stock levels, time of day, day of week, and demand spikes. When a competitor drops within minutes of your change, the trigger is you. When prices climb every Friday at 5 p.m., the trigger is weekend demand. The pattern names the rule the software is running.
Competitor-matching triggers
Run a controlled experiment. Change your price by a clean amount at a quiet time, then watch the rival SKU. If their price moves to sit just under yours within a predictable window, you have proven a match rule and measured its latency. That latency is gold: it tells you how long you can hold a low price before they react, and whether a fast promotion can capture sales before the algorithm catches up. This is also where Buy Box dynamics show up, since matching rules and Buy Box seller changes often move together on marketplaces like Amazon's seller marketplace.
Time and calendar triggers
Cross-reference the change timestamps with the clock. Consistent moves at the same hour reveal a scheduler. Consistent moves on the same weekday reveal demand-based rules. Over a few weeks you can predict what their price will be at a given hour, which lets you plan promotions around their weak windows.
Inventory and availability triggers
Price and stock often move together. If the price spikes whenever a size or color goes low, the repricer is reading inventory. Pair price tracking with availability tracking on the same page so your timeline shows both signals side by side. A jump from $42 to $58 means one thing on its own and a very different thing when the stock badge flipped to "Only 2 left" in the same minute.
How often should you check a competitor's price to catch repricing?
To catch repricing you must check faster than the algorithm moves. For fast-moving, high-competition SKUs, check every 2 to 5 minutes; for typical retail products, every 15 minutes is enough to map the cadence. Checking once or twice a day shows you the outcome of the algorithm and never the algorithm itself, because you undersample the changes.
The logic is the same as any sampling problem. If a repricer moves the price every 20 minutes and you check daily, you record roughly one in seventy moves and the timeline looks random. Tighten the interval until consecutive checks usually catch consecutive moves, and the pattern resolves into a clean cadence. A practical approach: start at 15-minute checks on priority SKUs, study the resulting density, then drop to 5-minute or 2-minute checks only on the products where the cadence is clearly faster than your sampling.
Check frequency maps directly onto plan tiers, so concentrate your fastest checks on the SKUs that move your revenue. You do not need 2-minute resolution on every product, only on the head items where a competitor's repricer is actively contesting the sale. The deciding factor is how short the check interval can go, since that ceiling sets the fastest cadence you can see.
How do you set up dynamic-pricing detection with PageCrawl?
Setting up detection means pointing price monitoring at one rival SKU at high frequency, capturing the price as a numeric value, and alerting whenever it undercuts you. The goal is a clean, dense change log plus a fast ping on each meaningful reprice, delivered on the check that spots it.
Here is the end-to-end setup. New monitors enable screenshots by default, which gives you a visual record of every captured price.
Step 1: Add the product page and pick price tracking. Create a monitor on the competitor's exact product URL (the variant you actually compete on, not a category page). Choose price or number tracking and select the price element on the page. This mode extracts the numeric value, so $43.97 is stored as 43.97, which is what makes a cadence chart and threshold rules possible, as explained in the guide to monitoring numeric values to spot trends. For products behind an account or member wall, use login-gated monitoring so the captured page is the real, signed-in price.
Step 2: Set a fast check frequency. For a contested head SKU, set checks to every 2 to 5 minutes on a higher tier, or every 15 minutes on Standard. Faster checks produce a denser timeline and reveal cadence sooner. Reserve your tightest intervals for products where the repricer is clearly active.
Step 3: Configure a threshold and direction. Price and number tracking lets you set a numeric threshold and a direction. Set the direction to "down" so you are alerted on drops, and add a threshold that fires when their price crosses below your own current price (for example, alert when it falls under $44.00). This turns raw noise into an actionable "they just undercut you" signal, and the reference on notification conditions and filters covers the per-page rule options. For multi-condition logic, layer conditional price and threshold rules so small algorithmic wiggles stay quiet and only real undercuts page you.
Step 4: Choose a notification channel. Route undercut alerts to where your pricing team already works. Send them to a Slack channel for price changes, or to Telegram, Discord, or a webhook. Fast delivery matters here, because the value of catching a reprice decays in minutes, and the alert lands on the check that finds the new price. If you measured a 17-minute reaction latency, a Slack ping at minute one gives you a window to respond before their next cycle.
Step 5: Keep screenshots on and add supporting signals. Leave the default screenshot capture enabled so every price has a visual proof image, which settles whether a number was real or a rendering glitch. On the same page, add availability tracking and a keyword or text rule for badges like "Sale" or "Lowest price," so your timeline records the context around each move, not just the figure.
Step 6: Pipe the history into a timeline you can analyze. Send every change to a live Google Sheets dashboard so each reprice lands as a timestamped row. Over a week this becomes your cadence chart. For automated responses, connect a webhook that reacts to each change and feeds your own repricing or reporting system. PageCrawl renders the page fully and reliably monitors protected sites, so the captured price reflects what a real shopper sees.
How do you turn a price log into a repricing timeline you can act on?
You turn a log into a timeline by exporting every captured change with its timestamp, then plotting price against time for the rival SKU. The shape of that line answers the strategic questions: when do they reprice, how fast do they react to you, and where are their margins soft. The export, not the latest number, is the deliverable.
Start by streaming changes into a spreadsheet or BI tool, one row per detected reprice, with columns for time, old price, new price, and the delta. Add a column for your own price at that moment so undercut events are visible at a glance. From there, three views earn their keep: a price-over-time chart that shows cadence density, an overlay of your changes against theirs that exposes reaction latency, and an hour-of-day histogram that reveals scheduler timing. If you track several rivals on the same SKU, a cross-retailer price comparison view shows whether they are all chasing one leader or pricing independently.
The payoff is prediction. Once you can say "this competitor resets at 6 a.m. and reacts to my moves within twenty minutes," you stop reacting and start planning. You time promotions for their slow windows, hold low prices only as long as their latency allows, and avoid unwinnable cent-by-cent wars with continuous chasers.
What mistakes make dynamic-pricing detection fail?
The common failures are checking too slowly to catch the cadence, tracking the wrong URL so the price never matches what shoppers see, and alerting on every micro-move until the team mutes the channel. Each one quietly defeats the project, and each has a direct fix in how you configure the monitor.
- Sampling too slowly. A daily check cannot reveal a 20-minute cadence. If the timeline looks random, your interval is too long; tighten it before concluding the rival is "stable."
- Wrong or generic URL. Category pages, region-redirected pages, or a default variant can show a different price than the one you compete on. Monitor the exact product variant, and use login-gated monitoring when the real price sits behind an account.
- Alert fatigue from raw moves. A continuous chaser can fire hundreds of tiny changes a day. Use thresholds and direction so you are paged only when the price crosses below yours, not on every cent.
- Ignoring landed cost. A competitor at $42 with $9 shipping is dearer than you at $44 with free shipping. Track shipping thresholds and fees alongside the sticker price so your "undercut" alert reflects what the customer actually pays.
- No baseline of your own price. Without your price in the timeline, you cannot tell an undercut from a routine wiggle. Record both lines so reaction latency and matching rules become measurable.
Avoid these and your monitor becomes a clean, readable map of someone else's pricing engine.
Choosing your PageCrawl plan
PageCrawl's Free plan lets you monitor 6 pages with 220 checks per month, which is enough to validate the approach on your most critical pages. Most teams graduate to a paid plan once they see the value.
| Plan | Price | Pages | Checks / month | Frequency |
|---|---|---|---|---|
| Free | $0 | 6 | 220 | every 60 min |
| Standard | $8/mo or $80/yr | 100 | 15,000 | every 15 min |
| Enterprise | $30/mo or $300/yr | 500 | 100,000 | every 5 min |
| Ultimate | $99/mo or $999/yr | 1,000 | 100,000 | every 2 min |
Annual billing saves two months across every paid tier, and Enterprise and Ultimate scale up if you need thousands of pages or multi-team access.
Where should you start detecting dynamic pricing?
Start with the single SKU where a competitor's repricer hurts you most, point a price monitor at it, and set checks to the fastest interval your plan allows. Within a few days the change history reveals the cadence, the triggers, and the reaction latency you have been guessing at.
Start free, watch one rival's algorithm reveal itself, and turn their moving number into your next move.