Maria buys stainless fasteners and copper busbar for a mid-size electrical assembly plant. Her contracts are not written in flat prices. They are written as base price plus a surcharge that floats against a published index, which means the number she actually pays next quarter is decided on a web page she does not own and does not control. In March she found out about a nickel-linked surcharge revision eleven days after her supplier posted it, because the notice went up as a PDF on a "Pricing and Surcharges" page nobody on her team had bookmarked. Eleven days of purchase orders went out at the old assumption. The variance landed in her quarter, not the supplier's.
Two floors up, an analyst named Devon has the mirror-image version of the same problem. He is not buying anything. He is trying to work out whether a lithium producer's guidance survives contact with the next round of published price data, and whether a refiner's margin story holds once the weekly petroleum figures land. Both of them need the same thing: to know when a specific published number on a specific page moves, without a human refreshing that page every morning.
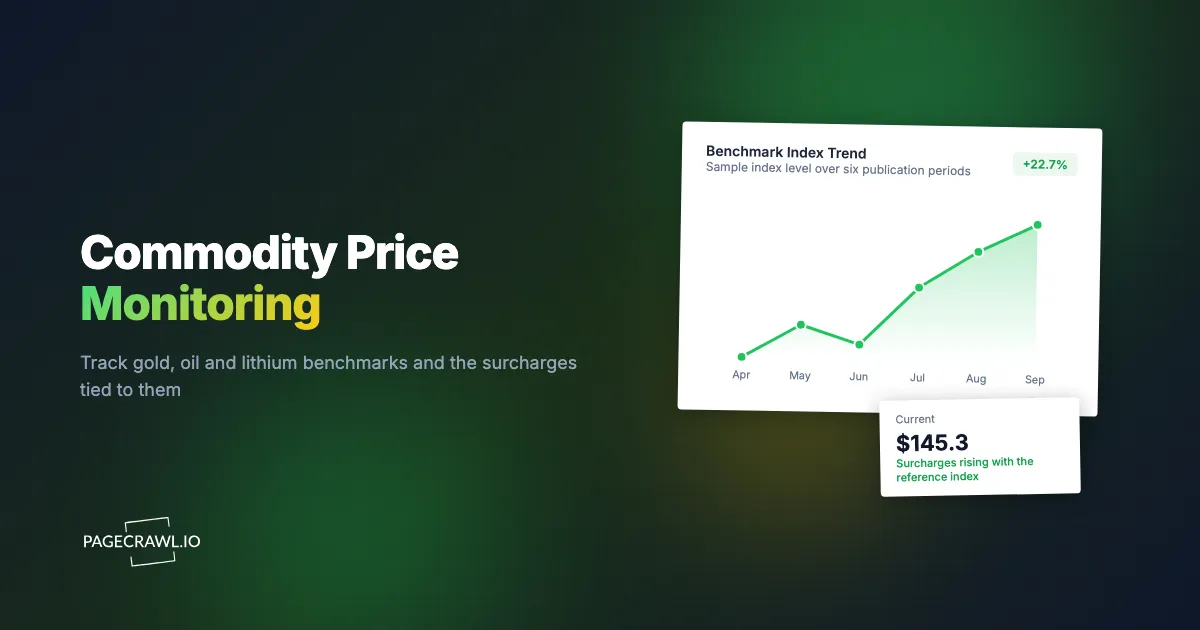
Commodity prices are unusual among the things worth monitoring: the authoritative sources are almost all public, almost all on a predictable schedule, and almost all published as a page or a document rather than a free API. That combination is exactly what page monitoring is for. This guide covers which pages carry real signal for gold, oil and lithium, how supplier surcharge pages tie back to those benchmarks, how to set the monitors up so they alert on movement rather than noise, and where the honest limits are.
Which commodity pages are actually worth monitoring?
Monitor the primary publisher, not an aggregator. For precious metals that means the benchmark administrator's own price page. For oil it means the government statistics agency that publishes the weekly and monthly series. For battery metals it means the official minerals data centre plus the exchange contract pages. Aggregators lag, reformat, and occasionally get it wrong.
The distinction matters more than it sounds. A finance blog quoting a gold figure is a derivative of a derivative. The LBMA Gold Price is the benchmark itself, set in twice-daily auctions administered by ICE Benchmark Administration and quoted in US dollars per fine troy ounce of gold. If your contract references that benchmark, that is the page whose value has contractual consequences for you.
Precious metals
The London bullion market publishes daily auction prices for gold and silver, with the gold auctions running in the morning and afternoon London time. For a buyer with a precious-metal content clause, or an investor tracking the spread between benchmark and a producer's realised price, that page is the anchor. Platinum and palladium have their own published benchmark series, which matter as much as gold if your bill of materials includes catalyst-grade metals.
Energy
The US Energy Information Administration petroleum data pages are the reference set for crude and refined products. The weekly petroleum status report is the highest-attention release, published on a fixed weekday schedule with holiday weeks shifted by a day, and the retail gasoline and diesel price series update on their own weekly cadence. For a fleet manager, the diesel series is the input to a fuel surcharge. For an analyst, the inventory tables are the number the market reacts to. Our post on gas and fuel price monitoring covers the pump-level version of the same discipline.
Battery and industrial metals
Lithium is the awkward one. There is no single public daily fix comparable to gold. What exists publicly is the USGS lithium statistics and information centre, whose annual Mineral Commodity Summaries chapter carries production, reserves and price commentary, plus exchange-listed contracts and producer disclosures. For copper, aluminium, nickel, zinc, lead and tin, the LME official prices page publishes day-delayed official prices, which is more than adequate for surcharge reconciliation even if it is not a trading feed.
| Commodity | Primary public source | Typical cadence | Who cares most |
|---|---|---|---|
| Gold, silver | LBMA benchmark price pages | Daily auctions | Jewellery, electronics, investors |
| Platinum, palladium | Published benchmark series | Daily | Auto catalyst, chemical |
| Crude, refined products | EIA petroleum data | Weekly and monthly | Refiners, fleets, traders |
| Diesel, gasoline retail | EIA retail price series | Weekly | Logistics, fuel surcharges |
| Copper, aluminium, nickel | LME official prices | Daily, day-delayed | Manufacturing, cable, alloy |
| Lithium | USGS summaries, exchange contracts, producer filings | Annual plus event-driven | Battery, EV, mining investors |
Why do supplier surcharge pages matter more than the benchmark itself?
For a buyer, the benchmark is an input and the surcharge is the invoice. Mills, distributors and chemical suppliers publish their own surcharge tables, index formulas and effective dates on their websites, often as a PDF that replaces last month's file at the same URL. That page decides your landed cost, and it changes on the supplier's schedule, not yours.
A steel service centre publishes an alloy surcharge derived from nickel, chrome and molybdenum inputs, effective the first of the month. An aluminium extruder publishes a Midwest premium adder. A freight provider posts a fuel surcharge table keyed to the published diesel average. In each case there is a formula, a reference index and an effective date, and all three can be revised.
What changes on a surcharge page
- The surcharge value itself, the number multiplied by your tonnage.
- The effective date, which determines whether orders already in the system are repriced.
- The formula or reference index, the change that quietly rewrites the contract's economics.
- The lag convention, for example moving from a two-month trailing average to a one-month one.
- Footnotes about minimums, floors, caps and exclusions.
Item three is the one that costs real money and gets noticed last, because the headline number can stay flat while the basis underneath it shifts. A monitor that captures the whole surcharge section, rather than just scraping one figure, catches formula and footnote edits that a number-only tracker will miss entirely. This is the same argument we make in our guide to supplier and distributor price list monitoring, where the price list PDF is the contract in practice regardless of what the master agreement says.
Surcharge pages are usually documents, not tables
Most suppliers publish surcharges as a PDF linked from a pricing page. That defeats naive scraping, and it is why document monitoring matters here. PageCrawl can extract and compare the text inside a linked PDF so a replaced file triggers a diff you can actually read, which our post on monitoring PDF documents for changes walks through. Watch both the landing page (in case the link, the file name or the effective date changes) and the document itself (in case the numbers inside change while the link stays identical).
How do you set up commodity price monitoring in PageCrawl?
Point a monitor at each published source, choose a tracking mode that matches whether you want a number or a document, set frequency to match the publication cadence rather than your anxiety, and route alerts to the channel where the person who acts on them actually lives. Most portfolios take under an hour to build.
- Add the URL. Start with one benchmark page and one supplier surcharge page so you can compare the two behaviours. Paste the full URL, including any query string that pins the series or the metal you care about.
- Pick the tracking mode. Use number tracking for a single published figure such as a daily benchmark or a surcharge value, so PageCrawl stores a clean numeric series you can threshold against. Use content or reader tracking for a surcharge notice, methodology page or effective-date announcement where the wording matters as much as the digits. Use document extraction when the real content lives in a linked PDF.
- Set check frequency to the publication cadence. A daily benchmark does not need 2-minute checks. A weekly government release does not need hourly ones. The exception is the release window itself: if a report drops on a known weekday morning, a tighter frequency for that page means the alert lands within minutes on higher plans rather than sitting until the next hourly sweep. The free tier checks every 60 minutes, Standard every 15, Enterprise every 5, Ultimate every 2.
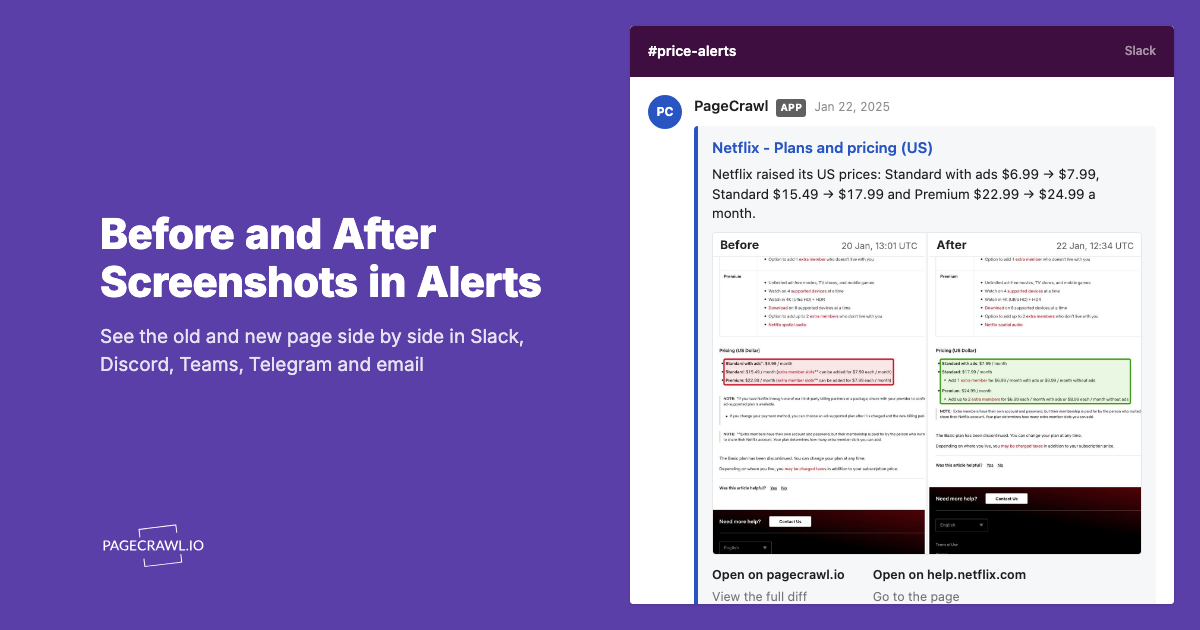
- Choose notification channels. Email suits a daily benchmark digest. Slack, Discord, Microsoft Teams and Telegram suit the surcharge notice that a buyer has to act on the same day, and our walkthrough on sending website change alerts to Slack covers routing changes into an existing procurement channel. Webhooks push the value into your ERP, a spreadsheet or a pricing model without a human retyping it.
- Add threshold and keyword rules. Fire only when a number moves more than a set percentage or crosses an absolute level, and only when a surcharge page's text contains words like "effective", "revised" or "surcharge". Our guide to conditional alerts using price, keyword and threshold rules shows how to keep a noisy source quiet until it says something you care about.
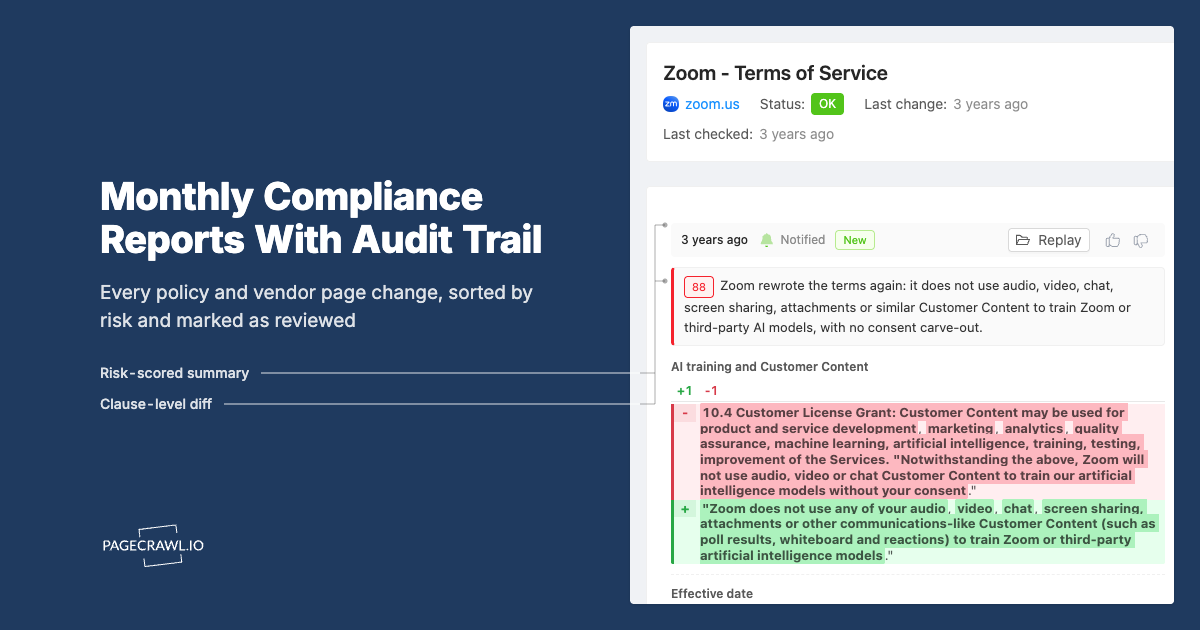
- Turn on screenshots and history. For a contractual dispute about which surcharge was in force on a given date, a timestamped capture of the supplier's own page is worth considerably more than your recollection.
- Group monitors in folders. One folder per commodity family (precious, energy, base metals, battery) or one per supplier, whichever matches how your team is organised. A shared folder is how the analyst and the buyer stop duplicating each other's monitors.
A sensible starter portfolio
A realistic first build for a procurement team is six to ten monitors: two benchmark pages feeding your largest input costs, four supplier surcharge pages covering your top spend, one freight fuel surcharge table and one methodology page. Investors swap the supplier pages for producer investor-relations pages and the statistical releases that move the sector.
How often do commodity sources actually change?
Cadence varies enormously by source, and matching your check frequency to it is the difference between useful alerts and a noise machine. Daily benchmarks post on a fixed schedule every business day. Government energy statistics land weekly and monthly on published calendars. Supplier surcharges are typically monthly with an effective date. Annual minerals summaries change once a year.
So do not run every commodity monitor at the same frequency. A page that updates once a year does not justify a 2-minute check, and burning your allowance on it starves the pages that matter.
| Source type | Change frequency | Suggested check frequency |
|---|---|---|
| Daily benchmark price page | Every business day | Hourly, tighter around the fix window |
| Weekly government statistics release | Weekly, fixed weekday | 15 minutes on release day, hourly otherwise |
| Supplier surcharge table | Monthly, plus mid-month revisions | Every 15 to 60 minutes |
| Index methodology or formula page | Rarely, without warning | Daily |
| Annual minerals or reserves summary | Yearly | Daily |
| Producer pricing announcement page | Event-driven | Every 15 minutes |
The rarely-changing pages are the ones people skip, and they are often where the biggest surprises live. A methodology page that has not moved in three years is the definition of low noise: if it ever does change, you want to know that day, and monitoring it costs you almost nothing.
What can go wrong with commodity monitors?
The three recurring problems are noise from timestamps and rotating tickers, sources that publish inside a document or a chart image rather than as text, and the temptation to treat a public benchmark as a substitute for a licensed data feed. All three are manageable if you design the monitor around them from the start.
Timestamp and ticker noise
Most price pages carry a "last updated" stamp, a session clock, a rotating headline strip or a live chart component. Left alone, these fire an alert on every check while the number you care about sits unchanged. Narrow the monitor to the specific element holding the value, or exclude the noisy regions once you see them in a diff. Our guide to reducing website monitoring false positives covers the exclusion workflow. A commodity monitor that alerts twelve times a day is a monitor nobody reads by Thursday.
Values that live in documents or images
Some publishers put the useful numbers in a downloadable spreadsheet or PDF, and some render a chart with no text equivalent. Document extraction handles the first case. A chart image is a genuine limitation: if a value exists only inside a rendered chart image with no accompanying figure in the page text, no page monitor can reliably read it. Look for the accompanying data table, the CSV link or the summary paragraph, which most official statistical publishers provide alongside the visual, and monitor that instead.
Licensing and access limits
Public benchmark and government pages are published for public reference. Many commercial price assessments are not, and the agency's subscription terms govern what you may do with those numbers. Monitoring a page you are entitled to see, for your own internal decisions, is ordinary use. Redistributing a licensed assessment because your monitor captured it is not. Day-delayed official prices are frequently sufficient for reconciliation work even when a live feed is not available to you.
Distributor portals that put a customer-specific price list behind a sign-in are monitorable with authenticated setup, but plan for the occasional re-authentication rather than assuming a portal monitor runs untouched for a year.
How should procurement and investors use the same data differently?
Procurement uses commodity monitoring to defend a budget: catch the surcharge revision before the purchase orders go out, verify that the invoice matches the published formula, and build an evidence trail for the next negotiation. Investors use it to test a thesis: watch the published series that drives a producer's realised price and the disclosures that reveal how much of it flows through.
The overlap is the data. The difference is the alert design and the response.
The procurement workflow
A buyer wants a small number of high-signal alerts routed to a channel where a decision gets made: a threshold alert on the surcharge value plus a content alert on the effective-date language, delivered to a shared Slack or Teams channel with the diff attached. The response is then mechanical. Recalculate the affected open orders, check whether the effective date captures anything in flight, and escalate if the formula changed rather than just the number.
The archive becomes leverage too. When a supplier proposes a new basis at renewal, a buyer with eighteen months of timestamped surcharge history can show how the previous formula behaved through the cycle instead of arguing from memory.
The investor workflow
An analyst wants breadth and provenance. Breadth means benchmark pages, statistical releases, producer pricing announcements and disclosure filings watched together, because a commodity thesis usually breaks at the seam between the published price and what a company actually realises. Provenance means a timestamped record of when a page said what, which is why pairing commodity monitors with SEC filings monitoring works: the price series tells you the environment, the filing tells you the effect.
Be honest about the limits. Public page monitoring is a clean, low-cost view of published information on a defined schedule. It is not a market data terminal and should not be described as one in a compliance conversation.
What does a complete commodity monitoring setup look like?
A complete setup covers four layers: the benchmark or index that your contracts reference, the supplier pages that translate that benchmark into your invoice, the methodology and calendar pages that govern how the benchmark is calculated and when it publishes, and the announcement pages where producers and agencies signal changes ahead of the data.
- Benchmark. Two to four pages, checked hourly, threshold alerts on meaningful moves rather than every tick.
- Supplier surcharges. One monitor per supplier pricing page and one per linked surcharge document, checked every 15 to 60 minutes, alerting on numeric change and on revision language.
- Governance. Methodology pages, publication calendars and index definitions, checked daily. These almost never change, which is exactly the point. When one does, it is material and you will be among the few people who noticed that week.
- Signal. Producer pricing announcements and the investor-relations pages of the companies that set the tone in your commodity, checked at your tightest frequency during known release windows.
Keeping the portfolio maintained
Commodity monitors rot in a specific way: suppliers reorganise their websites, statistical agencies renumber a series, a PDF moves to a new path. Review the portfolio quarterly. Any monitor that has reported no change at all across a period when you know the underlying number moved is broken, not quiet. A monitor showing zero diffs on a page that publishes monthly is the single most reliable symptom that a URL has silently changed.
Choosing your PageCrawl plan
PageCrawl's Free plan lets you monitor 6 pages with 220 checks per month, which is enough to validate the approach on your most critical pages. Most teams graduate to a paid plan once they see the value.
| Plan | Price | Pages | Checks / month | Frequency |
|---|---|---|---|---|
| Free | $0 | 6 | 220 | every 60 min |
| Standard | $8/mo or $80/yr | 100 | 15,000 | every 15 min |
| Enterprise | $30/mo or $300/yr | 500 | 100,000 | every 5 min |
| Ultimate | $99/mo or $999/yr | 1,000 | 100,000 | every 2 min |
Annual billing saves two months across every paid tier. Enterprise and Ultimate scale up to 100x if you need thousands of pages or multi-team access.
In event-driven strategies, minutes matter. One actionable signal surfaced before the broader market reacts can return more than a year of Ultimate. Standard at $80/year covers the core IR, press, and filings pages for a handful of positions. Enterprise at $300/year scales to a full watchlist. All plans include the PageCrawl MCP Server, so you can ask Claude to summarize every material change across a company's IR, press, and filings over any period you care about and get the evidence pulled straight from your monitoring archive. AI assistants can create monitors through conversation on every plan, including Free. Ultimate at $999/year adds 2-minute frequency and web archiving, which matters if you need provable timestamps for a thesis.
Getting Started
Pick the single commodity that drives the largest line in your budget or your model, and build two monitors for it: the primary published benchmark page, and the one supplier or producer page that translates that benchmark into a number you pay or forecast. Set the benchmark to hourly checks with a percentage threshold, and the supplier page to content tracking with an alert on the words "effective" and "revised".
Run that pair for one full publication cycle, a month for most surcharges. You will find out quickly whether your alerts are too noisy, too slow, or pointed at the wrong element, and it is far easier to tune two monitors than twenty.
Then expand in the order that pays: the rest of your top-spend suppliers, the methodology and calendar pages that almost never change, and finally the wider watchlist. Route the alerts into the channel where the decision actually gets made, and attach the diff so the person reading it can act without opening a browser.
Stop finding out about a surcharge revision eleven days late. Put the page on watch and let the change come to you.