Dana closed on her house at 7.25% because that was the number on the table the week her offer was accepted. She knew she would refinance eventually. She even wrote the target on a sticky note stuck to her monitor: 6.5%. For eleven months she checked two lender rate pages on Sunday evenings, saw nothing close to 6.5%, and closed the tabs. Then her loan officer called in March to say rates had touched 6.44% for about four days in February and were back near 6.8%. Sunday evening had landed on the wrong side of that window twice.
Her sticky note was not wrong. On a $350,000 balance, dropping from 7.25% to 6.5% cuts the principal and interest payment from roughly $2,388 to $2,212, about $175 a month, which pays back $5,000 of closing costs in under 30 months. She was staying in the house for at least ten years. She simply was not looking on the four days the trade existed.
Refinance windows are short because lender pricing moves with the bond market and is republished daily, sometimes more than once a day. A rate page is a live quote sheet with a points table attached, and the points table is where the real number hides. The fix is not more discipline. It is to stop looking manually: point a monitor at the lender pages you would genuinely borrow from, tell it the number that makes your math work, and let it interrupt you only when a check finds that number.
What is your refinance threshold, and how do you calculate it?
Your refinance threshold is the specific rate at which your break-even period becomes short enough to be worth doing. Divide your total closing costs by the monthly payment saving at a candidate rate. That gives break-even in months. If you will hold the loan comfortably longer than that, the candidate rate is your threshold.
The math is small enough to do once, in a spreadsheet, in ten minutes. Take Dana's numbers as a worked example: $350,000 remaining balance on a 30-year term at 7.25%, principal and interest of about $2,388 a month.
| New rate | Monthly P&I | Monthly saving | Break-even at $5,000 costs | Break-even at $8,000 costs |
|---|---|---|---|---|
| 7.00% | $2,329 | $59 | 85 months | 136 months |
| 6.75% | $2,270 | $118 | 43 months | 68 months |
| 6.50% | $2,212 | $175 | 29 months | 46 months |
| 6.25% | $2,155 | $233 | 22 months | 35 months |
Read the table sideways. At a quarter point of improvement the deal is bad at any realistic cost level, because you burn seven years recovering the fees. At three quarters of a point it is clearly good if you are staying put. The threshold is wherever that flip happens for your own holding period, which makes it a different number for every homeowner.
Closing costs are the variable most people guess at
The Consumer Financial Protection Bureau notes that every mortgage carries services and costs, and that a lender advertising a "no-closing-cost" refinance is generally recovering them another way: a higher rate, a lender credit, or costs rolled into the loan balance. Get a real Loan Estimate from at least one lender before you fix your threshold, because a guess of $3,000 against an actual $8,000 moves your break-even by years.
Write the threshold down as a number, not a feeling
A monitor can act on "alert me when the 30-year fixed shown on this page is at or below 6.50%." It cannot act on "alert me when rates get good." Committing to a number in advance also protects you from the most expensive refinance behaviour there is, which is waiting for the bottom, watching a qualifying rate come and go, and then anchoring on a price that never returns. If you are optimising total interest rather than monthly cash flow, run the same arithmetic against a term that keeps your payoff date roughly where it is, since refinancing four years in back to a fresh 30-year term lowers the payment partly by stretching it.
Which mortgage rate pages should you actually monitor?
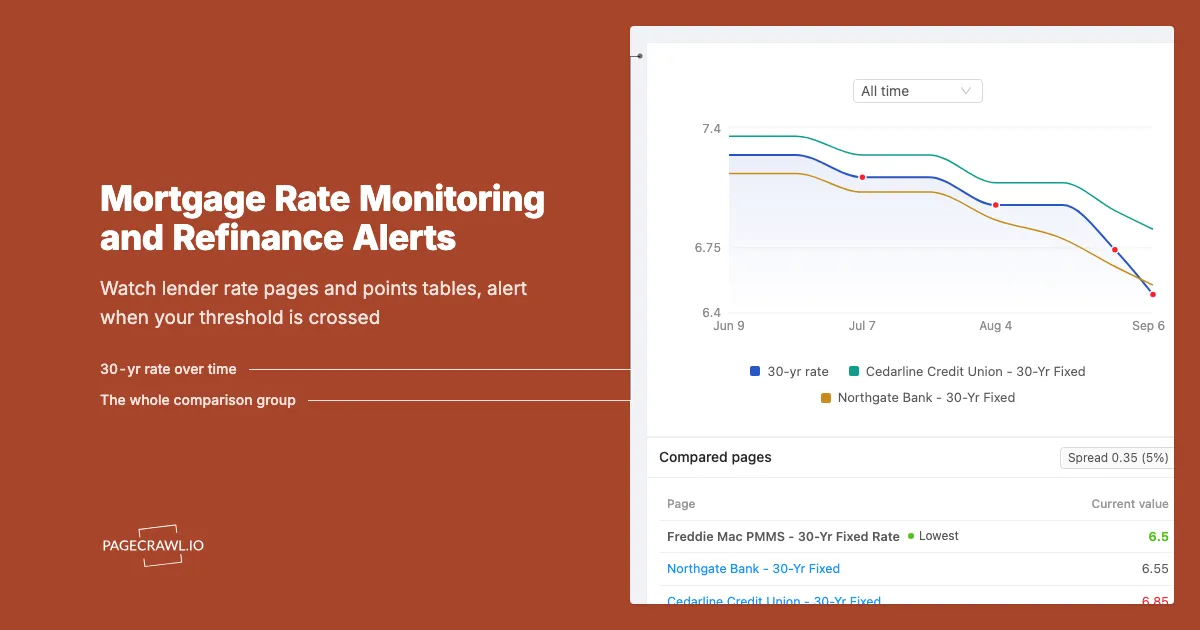
Monitor one national benchmark for direction plus two to four lender rate pages you would genuinely close with. The benchmark tells you whether the market is drifting toward your threshold. The lender pages carry the quotes you can lock. Watching twenty lenders produces noise you will start ignoring within a week.
The benchmark layer
Freddie Mac's Primary Mortgage Market Survey publishes average 30-year and 15-year fixed rates weekly, released Thursdays, and is the number most news coverage quotes. In its August 20, 2026 release, Freddie Mac put the 30-year fixed average at 6.65%. The same series is available as a downloadable history from the St. Louis Fed as FRED series MORTGAGE30US, which is useful if you want to see where today sits against the last two years rather than against last week.
Treat the benchmark as context, never as your trigger. It is a weekly national average of survey responses, so it lags daily lender pricing and it is not a quote anyone will honour for you.
The lender layer
This is the layer that matters. Most lenders, banks, and credit unions publish a today's-rates page listing 30-year fixed, 15-year fixed, and ARM products with an APR column and an assumed scenario note. Pick the two to four institutions you would realistically use: your current servicer, your credit union, and a national lender whose pricing you have already compared. Monitor the exact URL including any product or state parameter, because many lenders vary pricing by state and the default view may not be yours.
The application-volume layer
Refinance demand is itself a signal that a window has opened. The Mortgage Bankers Association Weekly Applications Survey publishes its refinance index every Wednesday. In the survey week ending June 5, 2026, MBA reported the Refinance Index up 15 percent from the prior week. Spikes like that mean a lot of homeowners just found a rate worth acting on, which is a useful cross-check that your own monitors are pointed at the right pages.
If you are also tracking deposit-side rates on the same household spreadsheet, the same approach works there, and our guide to bank savings and CD rate change monitoring covers the differences in how those pages are published.
Why do points tables change your real rate more than the headline number?
The headline rate on a lender page is one row of a pricing grid. The points column tells you what you are paying upfront to get it. A 6.5% quote costing 1.75 points on a $350,000 loan means roughly $6,125 in extra closing costs, which can push your break-even past the point where the refinance makes sense.
Discount points are prepaid interest: you pay cash at closing in exchange for a lower rate for the life of the loan. The CFPB explains the trade in both directions in its guidance on lender credits and discount points, noting that points are shown in section A on page 2 of your Loan Estimate and must be tied to an actual rate reduction, while lender credits do the reverse by cutting upfront cash in exchange for a higher rate.
The same page can advertise two different deals
Consider a simplified pricing grid of the kind lenders publish or quote:
| Advertised rate | Points | Upfront cost on $350,000 | Effective cost over 5 years |
|---|---|---|---|
| 6.875% | 0.000 | $0 | Payment only |
| 6.625% | 0.750 | $2,625 | Payment plus $2,625 |
| 6.500% | 1.750 | $6,125 | Payment plus $6,125 |
| 6.250% | 2.875 | $10,063 | Payment plus $10,063 |
A monitor that only watches the lowest number on the page will alert you on 6.25% and say nothing about the $10,063 attached to it. If your threshold assumed $5,000 in total closing costs, that alert is misleading rather than useful, which is why the points column belongs inside the monitored region.
Watch the assumption footnote and the APR column
Lender rate pages carry an assumed scenario in small print: a credit score, a loan-to-value ratio, an owner-occupied single-family property, sometimes an autopay requirement. When a lender quietly changes the assumed score from 740 to 780, every rate on the page improves without the pricing improving at all. Keep the footnote and the APR column inside the monitored region so the change history shows you the assumption shift alongside the rate shift. A rate that drops while its APR holds steady usually means the lender moved cost into points rather than improving the deal.
How do you set up refinance rate alerts in PageCrawl?
You add each lender rate page as a monitor, narrow the tracked region to the rate and points table, set the check frequency your plan allows, attach a numeric threshold rule at your break-even rate, and send the alert to a channel you will actually see during business hours. Setup runs about ten minutes per lender.
Add the URL. Copy the exact rate page address including any state, product, or loan-amount parameter. If the page defaults to a different state than yours, set the selector first and copy the resulting URL so every check sees your pricing.
Pick the tracking mode. Use number tracking on the 30-year fixed cell so PageCrawl stores a value you can compare and chart over time. Use text or content tracking on the whole table when you want the points, APR, and assumption footnote captured together. Running both on one lender gives you a numeric trigger plus a table monitor for the evidence.
Trim the region. Exclude what changes without meaning anything: last-updated timestamps, rotating banners, chat widgets, the mortgage calculator. Our guide to reducing website monitoring false positives covers teaching a monitor to ignore a region after it fires on it once.
Set the check frequency. Lender pricing is typically republished daily on business mornings, with intraday repricing when the bond market moves sharply. Hourly checks on the free tier catch essentially every daily reprice. The 15-minute frequency on Standard and the 5-minute frequency on Enterprise matter when you are close to your threshold and want an intraday move on the next check rather than the next morning.
Choose notification channels. Email suits the daily digest of where every lender sits. For the threshold alert itself use a channel you watch during working hours, since locking a rate means talking to a human: Slack, Discord, Microsoft Teams, and Telegram all reach your phone, and a webhook can post the new rate into a spreadsheet. Our email alerts setup guide covers the digest side.
Add the threshold rule. This is what makes the system quiet. Attach a numeric condition so the monitor only notifies you when the tracked rate is at or below your break-even number, plus a keyword condition on terms like "points" or "lender credit" if you want to hear about structural pricing changes too. Our walkthrough of conditional alerts using price, keyword, and threshold rules covers the rule types.
Turn on screenshot capture. A dated screenshot of the rate page as it looked when your alert fired is what you show the loan officer who says the number is different now. It is also how you reconstruct, months later, whether the 6.44% you remember came with two points attached.
Group the monitors in a folder. Name it "Refi Watch" and keep the benchmark, the lender pages, and the applications survey together. The change history then becomes a rate log you did not have to keep by hand.
If you are also shopping for a purchase rather than refinancing, our broader guide to mortgage rate monitoring and rate drop alerts covers the buyer side, including rate lock timing during an active home search.
How often should the checks run for refinance monitoring?
Daily checks catch most of what matters, because lenders publish new pricing on business mornings. Faster checks pay off in two situations: when you are within about an eighth of a point of your threshold, and during the economic release days when intraday repricing is most common. Outside those windows, hourly is plenty.
Match frequency to how close you are
When your threshold is three quarters of a point away, a daily check is sufficient: a move that large will not happen and reverse inside a day. Within an eighth of a point the calculus flips, because a lender can reprice midday, hold the better sheet for a few hours, and reprice back before close.
The days that reprice intraday
Bond markets, and therefore mortgage pricing, react hardest to a few scheduled releases: Federal Reserve policy announcements, the monthly employment report, and consumer price index days. Lenders frequently reprice mid-session on those dates. Raise your check frequency for the release day and drop it back afterwards rather than paying for a fast cadence year-round.
Weekly cadence for the benchmark
Freddie Mac's PMMS is published weekly on Thursdays and the MBA applications survey lands on Wednesdays, so checking those two more than once a day accomplishes nothing.
What goes wrong when monitoring lender rate pages?
Two problems recur: noise from page furniture that updates on every load, and pricing tables that arrive late or as a PDF rather than as HTML. Both are fixable in the first few minutes of setup, and both are why the first two checks of a new monitor are worth reading carefully.
Timestamps and banners that change every check
Almost every rate page carries a "rates as of" line that updates on every load, plus banners, chat prompts, and cookie notices. Left in the tracked region they fire an alert every check until you stop reading alerts entirely. Narrow the monitor to the table, then exclude any region that has fired twice without a rate having changed.
Tables that load late, or arrive as a PDF
Some lenders render their pricing grid after the initial page load, so check that the first capture shows numbers rather than a "loading rates" placeholder. Credit unions often post a weekly rate sheet as a PDF instead of an HTML table. That is monitorable too: point the monitor at the PDF URL and track the extracted text, so a changed rate or points column shows up as a diff.
How do you turn an alert into a locked rate?
An alert tells you a qualifying rate exists on a page. Locking it requires a formal quote, so treat the notification as the trigger for a phone call, not as the finish line. Have your paperwork assembled in advance, request a Loan Estimate the same business day, and compare it against the page you were monitoring.
Open the screenshot from the alert. Confirm the rate, the points, and the assumed scenario first. If the quote assumes 780 credit and 60% loan-to-value and you are at 720 and 80%, your real quote will be worse.
Call the lender the same business day. Published rates are indicative and pricing sheets are typically good for that day only. The rate you can lock comes from a formal application.
Ask for a Loan Estimate, not a verbal number. The Loan Estimate shows points in section A and is the only form that lets you compare lenders honestly. A verbal "about six and a half" is not comparable to anything.
Recompute break-even with the real numbers. Divide the actual closing cost total by the actual monthly saving and check the answer against your holding period. If it still clears, lock. If not, leave the monitors running.
Ask about the lock period and float-down. A 30-day lock on a refinance that will take 45 days to close creates a problem. Some lenders offer a one-time float-down if rates improve during the lock, usually for a fee.
Leave the monitors running after you lock. A float-down request has to be made while the better pricing is still on the page, and the only way to know it appeared is to still be watching.
Choosing your PageCrawl plan
PageCrawl's Free plan lets you monitor 6 pages with 220 checks per month, which is enough to validate the approach on your most critical pages. Most teams graduate to a paid plan once they see the value.
| Plan | Price | Pages | Checks / month | Frequency |
|---|---|---|---|---|
| Free | $0 | 6 | 220 | every 60 min |
| Standard | $8/mo or $80/yr | 100 | 15,000 | every 15 min |
| Enterprise | $30/mo or $300/yr | 500 | 100,000 | every 5 min |
| Ultimate | $99/mo or $999/yr | 1,000 | 100,000 | every 2 min |
Annual billing saves two months across every paid tier. Enterprise and Ultimate scale up to 100x if you need thousands of pages or multi-team access.
In event-driven strategies, minutes matter. One actionable signal surfaced before the broader market reacts can return more than a year of Ultimate. Standard at $80/year covers the core IR, press, and filings pages for a handful of positions. Enterprise at $300/year scales to a full watchlist. All plans include the PageCrawl MCP Server, so you can ask Claude to summarize every material change across a company's IR, press, and filings over any period you care about and get the evidence pulled straight from your monitoring archive. AI assistants can create monitors through conversation on every plan, including Free. Ultimate at $999/year adds 2-minute frequency and web archiving, which matters if you need provable timestamps for a thesis.
Getting Started
Do the break-even arithmetic first, because everything else depends on it. Take your current balance and payment, pick a candidate rate a half point below where you are, and divide a realistic closing cost estimate by the monthly saving. That number of months, checked against how long you will keep the house, gives you the rate to write down.
Then set up three monitors: Freddie Mac's PMMS for direction, and the rate pages of the two lenders you would genuinely close with. Narrow each one to the rate and points table, attach a threshold rule at your number, and route the alert to a channel you check during business hours. That fits inside the free tier with room to spare.
Leave it running through one full cycle of economic releases. The first time a lender page crosses your number and the alert reaches you on a Tuesday afternoon instead of the following Sunday, you will have your answer.
Stop refreshing rate pages. Write down the number that makes your refinance work, and let the alert find it.