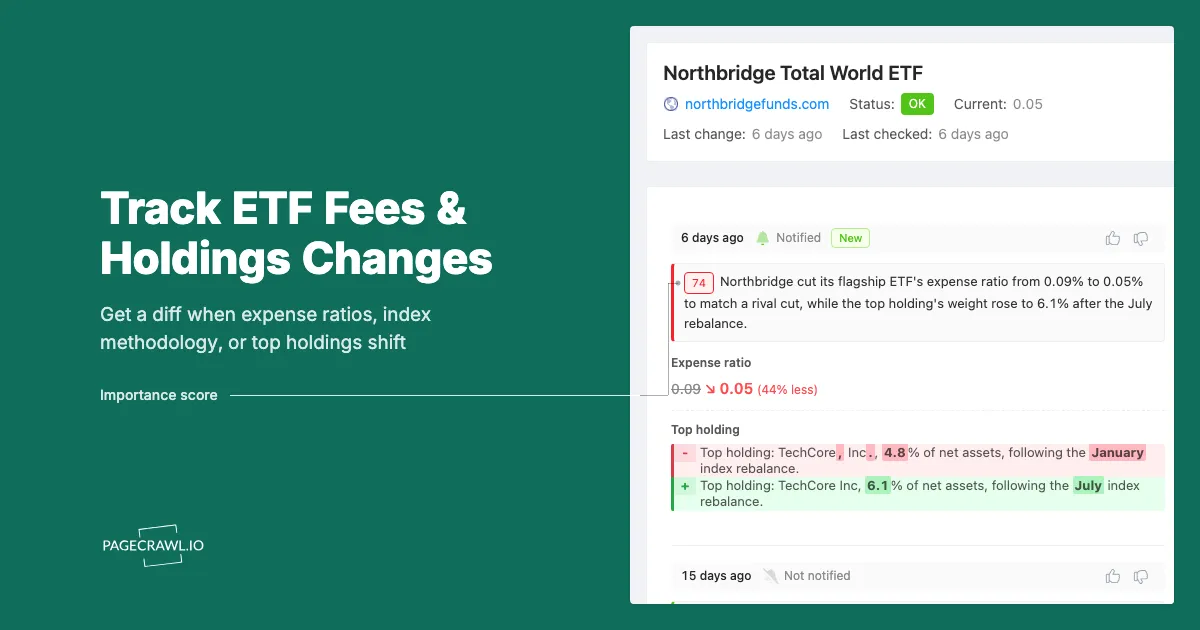
A fee-only advisor in Denver rebuilt her model portfolios in January and moved a large slice of client money into a broad developed-markets ETF at 0.09%. In April, a competing issuer cut an almost identical fund to 0.05%. She found out in September, from a client who had read about it on a forum. Nine months of a four-basis-point gap across the book was not a catastrophe, but the conversation was uncomfortable, and the honest answer was that nobody on her team had looked at the fund page since the day they bought it.
The awkward part is that the change was public the day it happened. Fee cuts are announced in a prospectus supplement, restated in the fund's fee table, and reflected on the issuer's product page, usually within the same week. Nobody sends you a letter. Index providers behave the same way: a methodology consultation opens, closes, and gets resolved on a schedule published months in advance, and the resulting change quietly redefines what a fund you already own actually holds.
A fund page carries a fee number, a waiver expiry date, an index name, a methodology link, and a top-ten holdings table, and every one of those is a decision trigger when it moves. This guide covers what changes on a fund page, where each change is published first, and how to set up a monitor that sends you the diff rather than leaving you to spot a two-decimal-place edit by eye.
Why does a few basis points of expense ratio actually matter?
Because fund fees are charged on assets, not on gains, and the industry now competes in single basis points. The Investment Company Institute reported in Trends in the Expenses and Fees of Funds, 2025 that the asset-weighted average expense ratio for index equity ETFs was 0.14%, while the simple average across all such ETFs was 0.45%.
That gap between 0.14% and 0.45% is the story of fee competition: investors concentrate their money in the cheapest products, and issuers cut headline fees on flagship funds to defend flows. ICI also found that over the nine years to 2025, expense ratios for index equity and index bond ETFs fell by 33% and 50% respectively. Those declines did not arrive as a smooth curve. They arrived as discrete announcements, each a monitorable event on a specific date.
Fee changes go in both directions
Fee news is usually framed as a race to zero, which trains people to assume there is no downside risk in ignoring it. There is. A contractual fee waiver has an expiry date printed in the prospectus, and when it lapses the net expense ratio steps back up to the gross number. A fund with a 0.29% management fee and a 0.19% waiver runs at 0.10% until the waiver date, then at 0.29% unless the board renews it. That is a near-tripling of cost on a fund that looks unchanged from the ticker alone. Small and thematic funds carry the most of this risk, because they lack the scale to subsidise a headline number.
The comparison set moves under you
You did not pick a fee, you picked a fee relative to alternatives. When a competitor cuts, your holding gets worse without a single character changing on its own page. Monitoring the two or three closest substitutes for each core holding is what tells you when a switch becomes worth the tax and spread costs.
Where do ETF fee and methodology changes get published first?
Fee changes are published first as a prospectus supplement filed with the SEC, typically on Form 497 or Form 497K, then propagate to the issuer's product page and the fund's fee table. Index methodology changes are published first by the index provider, usually as a consultation notice followed by a results announcement, then reflected in the fund documents.
That two-stage pattern is the key to useful monitoring, because it means two different pages give you two different lead times.
| Change type | Published first at | Then appears on | Practical lead time |
|---|---|---|---|
| Expense ratio cut or increase | SEC filing (Form 497 / 497K supplement) | Issuer product page, fee table, fact sheet | Days |
| Fee waiver expiry | Prospectus fee table footnote | Nowhere else, it just lapses | Months, if you read the date |
| Index methodology change | Index provider consultation and results notice | Fund prospectus, then holdings | Weeks to months |
| Index change for the fund itself | Prospectus supplement and issuer press page | Product page index name, holdings file | Weeks |
| Top-holdings shift | Issuer holdings file or Holdings tab | Fact sheet, quarterly reports | Same day to next day |
SEC filings carry the legal version
The SEC's EDGAR full-text search is the system of record. A fee cut, a fee increase, an index change, a name change, or a liquidation all arrive as a supplement filed against the trust that houses the fund, terse and dated. Our guide to monitoring SEC EDGAR filings covers the search-URL approach that catches new documents for a given filer.
The catch is that one trust can house dozens of ETFs, so a filer-level monitor on a large issuer produces plenty of documents you do not care about. Pairing it with a page monitor on the product pages you actually own solves that: the filing says something happened in the trust, the product page says whether it happened to your fund.
Index providers publish on a governance calendar
Index methodology is not changed casually. S&P Dow Jones Indices publishes index governance policies stating that material changes go through a public consultation, with results announced within a set window after the consultation closes. In July 2026, S&P Dow Jones Indices and MSCI jointly opened a consultation on potential changes to the Global Industry Classification Standard, running until 30 October 2026, with any resulting structural changes to be announced by November 2026. Classification changes of that kind reshape sector indices and therefore the composition of every sector ETF built on them.
Both providers publish these notices on their own sites, MSCI on its index resources pages and S&P DJI in its index announcements section. Those pages change infrequently and meaningfully, exactly the profile of a page worth watching.
What should you monitor on an ETF fund page?
Monitor four specific regions of the issuer's product page: the expense ratio figure (gross and net), the fee waiver expiry footnote, the tracked index name and methodology link, and the top-ten holdings table. Everything else on a fund page, the NAV, the daily flows, the market price, the premium and discount chart, changes constantly and should be excluded.
The fee block
This is the highest-value target and the easiest to get wrong. Issuer pages show gross expense ratio, net expense ratio, and management fee as separate numbers, and only one may move. Track the whole block as a text region rather than a single number so you can see which line changed. Net down with gross unchanged means a new waiver. Net rising toward gross means a waiver lapsed. Gross moving means the board repriced the fund.
The waiver expiry date
A footnote under the fee table names the date until which the adviser has contractually agreed to waive fees. That date is a scheduled future fee increase, and it is the most commonly ignored number in fund documents. Monitoring the footnote tells you when the date is extended (quietly common) and prompts a check when it is not.
The index name and methodology link
Funds change indices. A fund that switches from one provider's broad market index to another provider's version of the same idea has different constituents, different rebalance dates, and often a different fee. On the product page this is a handful of changed words: invisible to a human skimming for the fee number, obvious to a diff.
The top-ten holdings table
The top ten of a concentrated fund tells you more about your exposure than the strategy paragraph does. A thematic fund whose top holding drifts from 6% to 11% of assets is a different risk than the one you bought. For a full daily constituent diff rather than the top ten, our companion guide on ETF holdings composition change alerts covers monitoring the issuer's complete daily holdings file.
How do you set up ETF fee and holdings monitoring in PageCrawl?
Point PageCrawl at the issuer's product page for each fund, restrict tracking to the fee and holdings regions, check daily, and route alerts to wherever your investment team actually reads things. A first watchlist of core holdings and their nearest substitutes takes about twenty minutes to build.
Collect the URLs. For each fund you hold or shortlist, copy the URL of the issuer tab that actually renders the expense ratio, plus the same page for its two closest substitutes at rival issuers. If the fee lives on a separate "Fees" or "Documents" tab, use that URL.
Add each URL as a content monitor. Content tracking extracts the meaningful text and ignores layout and decorative elements, which is what you want on a page dense with widgets and charts.
Restrict tracking to the regions that matter. Keep the fee block, the footnote area, the index name, and the top-holdings table. Exclude NAV, market price, daily change, flows, and the premium/discount chart, or the monitor will alert you every trading day about nothing. Our guide to reducing monitoring false positives covers training a monitor to ignore a region after it fires once.
Set the check frequency to daily. Fee changes take effect on a stated date and are not a race, so one check after market close is plenty. The free tier's 60-minute checks are already faster than this needs; the constraint on a fund watchlist is page count, not interval.
Add keyword rules. Trigger on terms that only appear when something real happens: "expense ratio", "fee waiver", "effective", "supplement", "underlying index", "reorganization", "liquidation". Our walkthrough on conditional alerts using price, keyword, and threshold rules shows how to keep a monitor silent otherwise.
Add a numeric threshold where the page exposes a clean figure. If the expense ratio renders as a standalone number, track it as a number and alert on any movement. Fees do not fluctuate, so there is no noise floor to filter out.
Pick your notification channels. Email suits a digest to the investment committee. Slack, Discord, Microsoft Teams, and Telegram put the diff where portfolio decisions get argued about. Webhooks push the change into a portfolio system or research database so the alert opens a review task rather than landing in an inbox.
Turn on screenshots. A dated capture of the fee table on the day it changed is the artefact you want when a client or a compliance reviewer asks when you knew.
Group the monitors into folders. One folder per model portfolio, with each holding and its substitutes side by side, so the comparison you need is one click away.
Add the index provider pages. One monitor each on the announcements or consultation page behind your core holdings. They change rarely, cost almost nothing in monitor budget, and give you the longest lead time of anything on the list.
How do index methodology changes ripple into a fund you already own?
A methodology change alters which securities the index contains and how they are weighted, and the fund is contractually obliged to follow. You do not vote, and you rarely get a mailing. The change shows up as constituent turnover on the next rebalance, and the first public notice is on the index provider's site, often months before the effective date.
Classification changes reshape sector funds
When an industry classification framework is revised, companies move between sectors, which forces every fund tracking the affected indices to buy or sell them. For a concentrated sector ETF, one large reclassification can move several percent of the portfolio. The consultation S&P Dow Jones Indices and MSCI opened in July 2026 on the Global Industry Classification Standard is exactly this kind of event, and its timeline was public from the day it opened.
Screen and eligibility changes are quieter but bigger
Edits to eligibility screens are less visible than reclassifications and often more consequential: liquidity floors, free-float minimums, buffer rules around inclusion and deletion, capping schemes, and exclusion criteria in ESG or thematic indices. A tightened float requirement can drop dozens of names from a small-cap index. A revised capping rule changes the effective concentration of a top-heavy index without any constituent leaving. Neither generates a headline.
What goes wrong when monitoring fund pages, and how do you avoid it?
The three recurring problems are noise from daily pricing data, fee numbers that are rendered as images or loaded into interactive widgets, and treating an alert as a decision. All three have straightforward fixes, and none of them require you to check anything manually.
Daily NAV noise drowns the signal
An unfiltered fund page monitor fires every trading day, because NAV, market price, daily change, spread, and flow figures all update. After a week of meaningless alerts you will mute it and lose the fee change six months later. Restrict tracking to the fee block, the footnote, the index name, and the holdings table on day one.
Some issuers put the fee in a widget
Some fund pages render fee data inside an interactive component that loads separately from the main page text. If a monitor cannot see the number, monitor the fund's fact sheet PDF or summary prospectus instead. Both are stable, dated, and carry the full fee table plus the waiver footnote in its authoritative wording rather than a marketing paraphrase.
Alerts are triggers, not conclusions
A four-basis-point saving on a position with a large embedded capital gain is often not worth realising the gain to capture. An alert should open a short, structured review: the annual saving in dollars at your actual position size, the tax and spread costs of switching, and whether the substitute really tracks the same exposure. Write that decision rule once and apply it every time an alert lands. Our guide to event-driven investing with web monitoring covers the same discipline across the wider stack.
How do you scale this from a few funds to a full due diligence process?
Tier the watchlist by how much money sits behind each decision, monitor substitutes alongside holdings, and add the upstream sources (SEC filings and index provider announcements) for anything you would act on. A hundred monitored pages covers a serious model-portfolio program including substitutes.
| Tier | What to monitor | Check frequency | Why |
|---|---|---|---|
| Core holdings | Product page fee block, index name, top ten | Daily | Direct cost and exposure changes |
| Substitutes | Product page fee block only | Daily | Tells you when switching becomes worthwhile |
| Index providers | Consultation and announcement pages | Daily | Longest lead time of any source |
| Issuer filings | EDGAR filer search for the relevant trusts | Daily or faster | Legal version, earliest confirmation |
| Watchlist candidates | Product page fee block | Weekly | Cheap to keep, useful at review time |
Reviewing the archive rather than the inbox
The point of a year of monitoring is not the alerts, it is the record. Answering "how many times did this issuer reprice this fund, and when" without reconstructing it from press coverage is a research asset, and it supports the harder question of whether an issuer's fee cuts tend to precede index changes or reorganisations. Our post on 13F institutional holdings change monitoring covers the quarterly side of the same discipline.
Choosing your PageCrawl plan
PageCrawl's Free plan lets you monitor 6 pages with 220 checks per month, which is enough to validate the approach on your most critical pages. Most teams graduate to a paid plan once they see the value.
| Plan | Price | Pages | Checks / month | Frequency |
|---|---|---|---|---|
| Free | $0 | 6 | 220 | every 60 min |
| Standard | $8/mo or $80/yr | 100 | 15,000 | every 15 min |
| Enterprise | $30/mo or $300/yr | 500 | 100,000 | every 5 min |
| Ultimate | $99/mo or $999/yr | 1,000 | 100,000 | every 2 min |
Annual billing saves two months across every paid tier. Enterprise and Ultimate scale up to 100x if you need thousands of pages or multi-team access.
In event-driven strategies, minutes matter. One actionable signal surfaced before the broader market reacts can return more than a year of Ultimate. Standard at $80/year covers the core IR, press, and filings pages for a handful of positions. Enterprise at $300/year scales to a full watchlist. All plans include the PageCrawl MCP Server, so you can ask Claude to summarize every material change across a company's IR, press, and filings over any period you care about and get the evidence pulled straight from your monitoring archive. AI assistants can create monitors through conversation on every plan, including Free. Ultimate at $999/year adds 2-minute frequency and web archiving, which matters if you need provable timestamps for a thesis.
Getting Started
Start with your three largest fund positions. Open each issuer product page, add it to PageCrawl as a content monitor, and restrict tracking to the fee block and the top-ten holdings table so daily NAV updates stay silent. Set a daily check and route alerts to email plus whichever channel your team actually reads.
Next, add one substitute fund per core holding from a rival issuer. This is the pair that tells you when a switch is worth doing, and it doubles the value of the first three monitors without doubling the work.
Then add the index provider announcement page behind your largest holding. It changes a handful of times a year, and when it does, you will know months before the fund page catches up.
Your funds are quietly repricing and re-indexing without telling you. Set up the first three monitors today and start reading the diffs instead of the marketing pages.