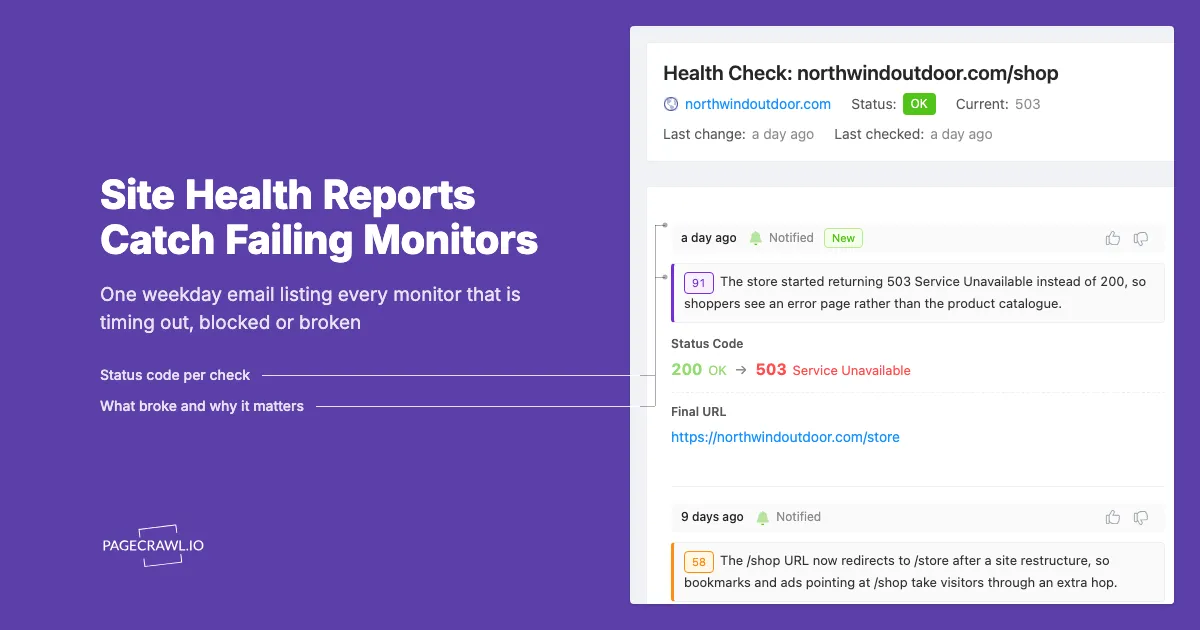
A quiet inbox is supposed to mean nothing changed. But a quiet inbox also looks exactly the same when a monitor has not loaded its page for a week. The site started blocking visitors, a product page was removed, a certificate expired, or the element you tracked was renamed in a redesign. No change was detected, so no alert went out, and you only find out when someone asks why nobody noticed the competitor's price rise.
The Site Health report closes that gap. It is a scheduled digest that ignores changes entirely and lists only the monitors that are currently failing, with the reason for each one. When everything is healthy, it sends nothing.
This guide covers how to set it up, what each failure in the report tells you, and the different ways teams use it, from a single weekday email to a full health programme across hundreds of monitors.
What is a Site Health report?
A Site Health report is a scheduled PageCrawl digest that lists every monitor in scope that is currently in a failing state, such as a timeout, a block, a server error, an SSL error, a missing page or a missing element. It skips change summaries completely and is only sent when at least one monitor is failing, so a healthy workspace produces no email.
It is built on the same scheduled reports engine as change briefings, with two settings switched on:
- Include failing pages adds a list of monitors that are not in a healthy state.
- Failures-only digest removes everything else. There is no AI summary, no change list, no grouping and no Excel data, just the monitors that need attention.
The result reads like a to-do list. Each row is a monitor that is not doing its job right now.
Why do you need a report for failing monitors?
Monitoring only protects you while the checks succeed. A monitor that fails quietly gives the same signal as a page that did not change, which is no signal at all. A Site Health report turns that silence into a short, dated list, so broken monitors get fixed in days instead of being discovered months later.
Failures build up for ordinary reasons, and most of them have nothing to do with PageCrawl:
- Sites redesign. The price or headline you tracked moves to a new element, and the old selector no longer matches anything.
- Pages are removed or moved. Product pages get discontinued, documentation is restructured, and old URLs start returning 404.
- Sites add protection. A page that loaded fine for a year starts showing a challenge page or an access denied response.
- Servers have bad weeks. Timeouts and 5xx errors come and go. One failure is noise; a run of them is a problem.
- Logins expire. Monitors behind a sign-in stop working when a password changes or a session policy tightens.
- Certificates lapse. Certificate lifetimes keep getting shorter (Let's Encrypt certificates, for example, are valid for 90 days), so renewal slips happen more often than they used to.
If you run five monitors, you will notice. If you run 50 or 500, spread across folders and teammates, you will not, unless something tells you.
How do you set up a Site Health report?
Open Settings, choose Notifications, scroll to Scheduled Summary Reports and click Add Report. Pick the Site Health template, review the pre-filled settings, and click Create report. The template already covers all monitors, sends on weekdays at 08:00 and only lists failures, so most teams can save it as it is.
Step by step:
- Go to Settings > Notifications. Reports live in the Scheduled Summary Reports section, below the per-change alert settings.
- Click + Add Report. The Pick a starting point window opens with a gallery of templates.
- Choose Site Health ("Daily digest of monitors that are currently failing - timeouts, blocks, 4xx/5xx, SSL errors. Skips when everything is green.").
- Check the pre-filled form:
- Include changes from: All monitors
- Send: Weekdays only
- Time: 08:00 in your workspace timezone
- Delivery: Email
- Content filters: Include failing pages and Failures-only digest both on
- Adjust anything you need (scope, send time, recipients) and click Create report.
- When PageCrawl asks Generate a sample digest?, click Generate sample to see what the report would contain right now.
Scheduled reports are available on paid plans. If you would rather build it by hand, choose Start from scratch, then switch on Include failing pages and Failures-only digest under Content filters. The template is simply those two switches with sensible defaults.
What does the Site Health report show?
Each digest lists the failing monitors in scope, most recently checked first. Every row shows the monitor name, the failure status, how many checks in a row have failed, when the last check ran, and three actions: open the monitor in PageCrawl, visit the page itself, or stop monitoring it. The email subject tells you the count, for example "Site Health: 4 monitors failing".
What each part tells you:
| Field | What you learn |
|---|---|
| Monitor name | Which page is affected (the URL is used when a monitor has no name) |
| Status | Why it is failing: timeout, blocked, server error, selector not found and so on |
| "failing for N checks" | Whether this is a blip or a pattern. Shown once a monitor has failed more than once in a row |
| Last checked | How recently PageCrawl tried, so you can tell a fresh failure from a stale one |
| View page | Opens the live URL so you can see what a visitor sees |
| Stop monitoring | A one-click link to pause a monitor that is no longer worth tracking |
The Stop monitoring link is the underrated part. Plenty of failing monitors do not need fixing, they need retiring: a discontinued product, a campaign page that ended, a competitor that shut down. Pausing them from the email keeps the report short and your check allowance spent on pages that matter. The link asks for confirmation before it pauses anything and expires after seven days.
The same digest is saved to the report's History, where team members can open it in the browser and print it, which is useful when you need a dated record of monitoring coverage for an audit or a client.
What do the different failure statuses mean?
Failure statuses fall into five groups: the site could not be reached, the site refused the visit, the server returned an error, the page loaded but the tracked content was missing, or a sign-in failed. Each group has a different fix, so reading the status first saves you from opening every monitor to find out what went wrong.
The site could not be reached
- Timeout. The page did not finish loading in time. Often temporary; a long run of timeouts usually means a slow or overloaded site.
- Unreachable. The domain did not answer at all. Look for an expired domain, a DNS problem or a site that has been taken offline.
- SSL error. The secure connection failed, typically an expired, mismatched or misconfigured certificate. If it is your own site, this one is urgent.
- Too many redirects / Unexpected redirect. The URL loops or now sends visitors somewhere else, often after a site migration.
The site refused the visit
- Blocked, Access denied, 403 forbidden, 429 rate limit. The site's security layer did not let the check through. Our guide to fixing 403 and access denied monitors and the help article on how to unblock a blocked page walk through the options, from changing the check location to slowing the frequency.
PageCrawl already retries these statuses on its own before a check counts as failed, so a monitor in this list has failed repeatedly, not once.
The server returned an error
- Unavailable, Soft error. The server answered with a 5xx error or an error page. The HTTP status code reference on MDN explains each code if you need to know exactly what the server said.
- 404 page not found. The page is gone. In a Site Health report, missing pages appear in the failing list. (In regular change reports they get their own Missing Pages section with suggested replacement URLs instead.)
The page loaded, but the content is missing
- Selector not found / Number not found. The page works, but the element you tracked is no longer there. This is the classic redesign failure. Open the monitor and pick the element again.
- Blank page. The page loaded with nothing meaningful on it.
- Product unavailable / Currency mismatch. On price monitors, the product could not be read or showed a different currency than expected, often because of a region or storefront change.
The sign-in failed
- Login failed / Requires auth. A monitor behind a login could not sign in. Update the saved website login and run a check.
A useful habit: sort your response by status, not by monitor. Five "selector not found" rows on the same domain usually mean one redesign, and fixing the first one tells you how to fix the rest.
What can you learn from a Site Health report over time?
A single digest tells you what to fix today. A few weeks of digests tell you which sites are unreliable, which monitors are set up too fragilely, and whether your monitoring coverage is actually as complete as you think. The report history gives you that trend without any extra tooling.
Patterns worth watching:
- The same monitor every day. A chronic failure is not a blip. Either fix the setup or stop monitoring it.
- Many monitors on one website failing together. The site changed something structural: a redesign, a new security layer, or a move to a new domain.
- Selector failures after a competitor launch. Redesigns often ship alongside launches, so a burst of missing elements is itself a signal worth a look.
- Blocks appearing on a site that used to work. The site has tightened its protection, which can be worth knowing competitively.
- Your own sites in the list. SSL errors, 5xx errors or timeouts on pages you own are a production problem, not a monitoring problem.
- A report that rarely arrives. That is the goal. A Site Health report that stays silent for weeks is evidence your monitoring is working.
How can you customise the Site Health report?
Every setting in the template can be changed. You can narrow the scope to a tag, folder, website or hand-picked monitors, change the send days and time, add teammates or outside recipients, or run several Site Health reports side by side, one per team or client, each only listing the failures its audience owns.
Scope: whose failures, not all failures
Include changes from accepts All monitors, By tag, By folder (subfolders included), By website, or Specific monitors. Tag and folder scopes are dynamic, so new monitors join the report automatically.
Useful splits:
- Per team. A
#pricingSite Health report goes to the pricing analyst, a#legalone goes to compliance. Each person only sees the monitors they are responsible for. - Per client. Agencies can scope one report per client folder, so account managers get the failures for their own accounts. See the agency monitoring guide for how to structure folders.
- Your own properties. Scope a report to your own domains with By website, send it early, and treat any row as an incident.
Schedule: how fast you want to know
Send offers Daily, Weekdays only, Weekends only, Weekly, Monthly and On-demand only, at any hour in your workspace timezone.
| Situation | Suggested schedule |
|---|---|
| Monitors that feed daily decisions (pricing, stock, compliance) | Weekdays only, first thing in the morning |
| Monitors covering your own websites | Daily, including weekends |
| Large research or archive programmes | Weekly, Monday morning |
| Client or management reporting | Monthly, printed from History |
| Ad-hoc audits | On-demand only, then Generate now |
Because the report is skipped on days with no failures, a daily schedule is cheap on attention. You only hear from it when there is something to do.
Recipients
Email goes to workspace members you select, and you can + Add Cc / Bcc verified outside addresses, such as a client or a web agency responsible for a site. Each recipient can unsubscribe from a single report without affecting the others.
Email is the best fit for this report because it carries the full failing list with the status and actions on every row. Slack, Discord, Teams and Telegram get a shorter message with the failing count and the first five failing monitors, each with its status and a link. Anyone who can open the digest link sees the full list in the browser, and it appears in the PageCrawl mobile app with the failing count.
How does the Site Health report differ from error alerts?
Error alerts fire on a single monitor as it fails; the Site Health report summarises every failing monitor on a schedule. Alerts suit a few critical pages where you want to hear on the next failed check. The report suits everything else, because it batches dozens of failures into one message instead of dozens of separate notifications.
Each monitor has a Report Errors setting in its advanced options:
- Immediately, when error occurs
- After 3, 5, 10, 15 or 30 failed checks
- Never report errors
A setup that works well for most teams:
- Keep Report Errors at a few failed checks for the handful of pages where a failure costs money (your checkout, a key supplier, a regulator's page).
- Set noisier monitors to a higher threshold or Never report errors.
- Let the Site Health report catch everything, every weekday morning.
For expected failures, the Suppress Errors setting lets a monitor treat Selector Not Found or Page Not Found (404) as normal, for example a "sold out" banner that only exists some of the time. Suppressed monitors stay out of the report.
If you want failures in your own systems, the error webhook event sends the failure status of each failed check to any endpoint, which is how teams route monitor health into an incident tool or a ticket queue. The webhook automation guide covers the setup.
Can PageCrawl monitor site health signals directly?
Yes. Besides reporting on monitors that fail, PageCrawl can track health signals as their own values, so a change becomes a normal change alert. Tracking types include HTTP Status, Redirect, DNS Records, SSL Certificate, Security Headers, Page Resources and WHOIS, each recording the value on every check and flagging when it moves.
These complement the Site Health report rather than replace it:
- HTTP Status records the code a URL returns, so a page moving from 200 to 301 or 404 is a tracked change with a timeline. RFC 9110 defines what each status class means.
- Redirect records where a URL ends up. The redirect monitoring guide shows how to catch migrations and hijacked links.
- DNS Records tracks record values such as MX, TXT and nameservers. See monitoring SPF, DKIM and DMARC records.
- SSL Certificate tracks the certificate a site presents, including its issuer and expiry, so a renewal (or a missed one) shows up in the timeline.
- Security Headers tracks headers such as Content-Security-Policy and Strict-Transport-Security, useful when a deployment silently drops one.
A practical combination for your own websites: HTTP Status and SSL Certificate monitors on your key URLs, with the Site Health report scoped to your domains so any monitor that cannot load at all is listed the next morning.
Frequently asked questions about Site Health reports
Does the report send an email when nothing is failing?
No. A scheduled Site Health report is skipped when no monitor in its scope is failing, and no digest is recorded for that day. Manual runs with Generate now always create a digest in History so you can confirm the report works.
Does it include pages that return 404?
Yes. In a failures-only digest, monitors returning 404 are listed with the other failures. Regular change reports handle 404s differently, in a separate Missing Pages section with suggested replacements.
How many failing monitors can one report list?
The digest lists up to 50 failing monitors, most recently checked first. Very long lists are shortened in the email with a link to view the rest in the full digest. If you regularly hit that, split the report by folder or tag so each owner gets a list they can work through.
Will a single slow check put a monitor in the report?
A monitor appears while its latest check has failed. PageCrawl retries blocks, timeouts and server errors automatically before recording a failure, and the "failing for N checks" count helps you separate a one-off from a real problem.
Can I share the report with a client?
Yes. Add the client's verified email as Cc or Bcc and they receive the full failing list. For periodic reporting, open the digest from History and print it.
Start with one report
Set up the Site Health template on all monitors, keep the weekday 08:00 default, and let it run for two weeks. Fix or retire whatever shows up. After that, split it by team or client if the list is getting long, and add HTTP Status and SSL Certificate monitors for the sites you own. For the full reference on scheduled reports, including every scope and schedule option, see Monitoring Reports.