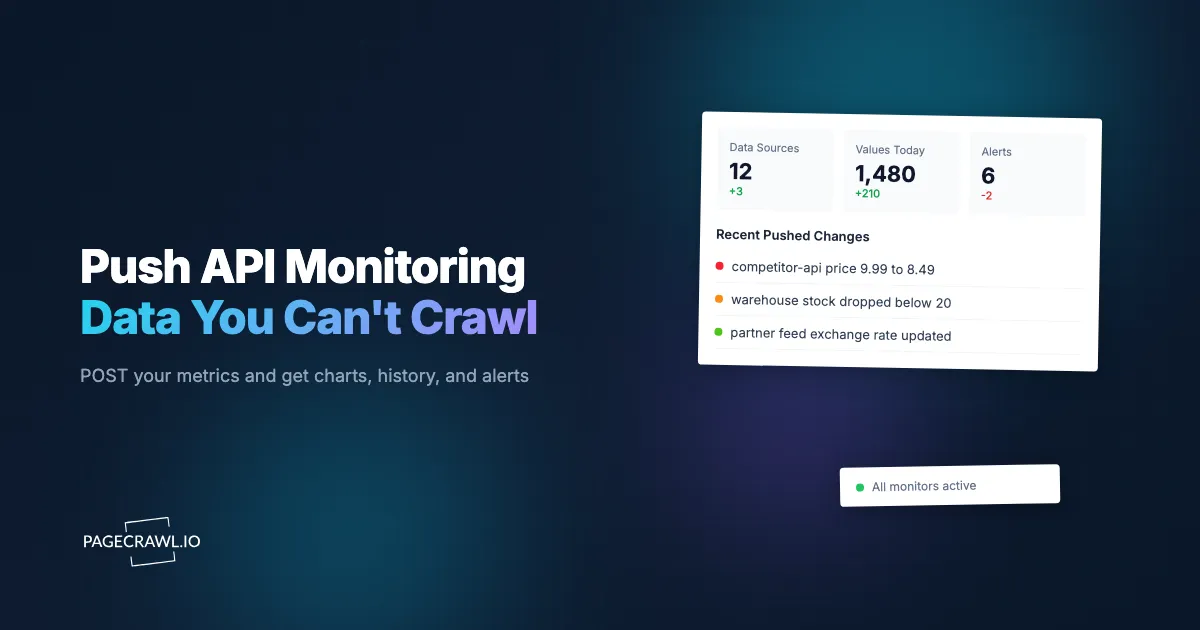
Some of the data you care about most never appears on a public web page. A competitor's changelog that only exists in a feed, incident text from a partner's status API, a product description in a supplier portal, your own signup count. You cannot point a page monitor at any of them, but you still want the same things a page monitor gives you: a record of every change, an AI summary of what moved, and an alert when something important happens.
PageCrawl data sources solve this by reversing the direction of the data. Instead of PageCrawl fetching a page, you push values in with a one-line POST request (or an email), and each value flows through the same change detection pipeline as any monitored page, including AI summaries and priority scoring. This guide covers how data sources work, the full API, and two end-to-end examples.
What is push-based monitoring?
Push-based monitoring reverses the usual flow. Instead of PageCrawl opening a page on a schedule, your systems send values to a secret ingest URL with a single POST request, or by email. Each received value gets the same change comparison, history, charts, notifications, and AI summaries as any monitored web page.
With crawl-based monitoring, PageCrawl decides when to look and extracts the value from a page. With push-based monitoring, you decide when to send and what the value is. Everything downstream is identical: PageCrawl compares the new value against the last one it stored, records a check, and notifies you through your configured channels when something changed.
A data source behaves like any other monitor in the app. It appears in your pages list, has a history of checks, and numeric fields get charts automatically.
When should you push data instead of crawling?
Push data when the value you care about is not on a public web page: internal KPIs, numbers behind a login, partner data feeds, output from your own scripts, or values returned by a third-party API. If a stable public URL shows the value, regular monitoring is usually simpler. Push covers everything else.
Typical cases where pushing wins:
- Third-party API and feed values. A competitor's changelog feed, a status API, or a supplier endpoint returns JSON or raw text, not a page. A small script can fetch it and push the parts that matter.
- Text you want AI to read. Changelog entries, status page wording, product descriptions, policy snippets. Push the raw text and let AI summaries and priority scoring tell you what changed and how much it matters.
- Internal metrics. Daily signups, error counts, queue depth, revenue. The data lives in your warehouse or admin panel, not on the open web.
- Partner and vendor feeds. Inventory levels, exchange rates, delivery SLAs that arrive as files, API responses, or emails instead of on the supplier pages supply chain monitoring watches directly.
- Systems that can only send email. Legacy tools, cron jobs on locked-down servers, and no-code platforms can email a value to a private address instead of calling an API.
- Values that need computation. Anything you derive yourself, like a ratio of two numbers or a score from your own model.
If the value is on a page PageCrawl can reach, use a regular monitor and let PageCrawl do the fetching. The developer guide to the monitoring API covers that side in depth.
How do you create a data source?
Create a data source in the app under Settings > API > Data Sources, or with one authenticated POST request to the data sources endpoint. Give it a name, and optionally define the fields you want to track. The response includes the new monitor's slug, its tracked elements, the secret ingest URL you push values to, and a private inbound email address.
The create call itself uses a Bearer API token from Settings > API, the same token used for the rest of the REST API:
curl -X POST "https://pagecrawl.io/api/data-sources" \
  -H "Authorization: Bearer YOUR_TOKEN" \
  -H "Content-Type: application/json" \
  -d '{
    "name": "Competitor changelog",
    "fields": [
      {"label": "entry", "type": "text"},
      {"label": "version", "type": "text"}
    ]
  }'
The fields array is optional. Leave it out to track a single value, which is the right shape for "one number or one block of text I care about" cases like a KPI or a changelog entry.
A successful request returns 201 with the monitor object:
{
  "id": 55,
  "slug": "competitor-changelog",
  "ingest_url": "https://pagecrawl.io/api/ingest/data-a1b2c3d4e5f6g7h8i9j0k1l2",
  "ingest_email": "data-a1b2c3d4e5f6g7h8i9j0k1l2@ingest.pagecrawl.io",
  "elements": [
    {"label": "entry", "type": "text"},
    {"label": "version", "type": "text"}
  ]
}
The ingest_url and ingest_email are also shown in the app when you create the source and on the monitor's Send data panel. You can also pass an optional email_sender_filter (an exact address or a domain) to restrict who is allowed to email values into this data source.
How do you push a value?
Send a POST request to the data source's secret ingest URL. The URL itself is the credential, so there is no API token and no Authorization header. The body can be form-encoded or JSON, a single value or a map of field names to values, and PageCrawl records a change only when something actually differs.
The whole thing is one line:
curl -d value=42 https://pagecrawl.io/api/ingest/data-a1b2c3d4e5f6g7h8i9j0k1l2The same call from code, here with the Python requests library:
import requests

requests.post('https://pagecrawl.io/api/ingest/data-a1b2c3d4e5f6g7h8i9j0k1l2', json={'value': 42})fetch('https://pagecrawl.io/api/ingest/data-a1b2c3d4e5f6g7h8i9j0k1l2', { method: 'POST', headers: { 'Content-Type': 'application/json' }, body: JSON.stringify({ value: 42 }) });Multiple named fields work the same way, form-encoded or as JSON:
curl -d 'values[sentiment]=positive' -d 'values[mentions]=12' https://pagecrawl.io/api/ingest/data-a1b2c3d4e5f6g7h8i9j0k1l2The response tells you whether anything changed:
{
  "changed": true,
  "check_id": 123,
  "monitor_id": 55,
  "values": {"sentiment": "positive", "mentions": "12"},
  "created_fields": ["sentiment", "mentions"]
}
Treat the ingest URL like a password: anyone who has it can record values into that data source. If you would rather not store it in a script, there is an authenticated alternative: POST to /api/ingest/competitor-changelog (the slug from the create response) with your regular Authorization: Bearer API token. Both variants accept the same bodies and return the same responses.
Two behaviors make the endpoint easy to script against:
- Idempotent by value. Pushing the same value again returns
"changed": falseand stores nothing new, so a cron job that pushes every 10 minutes does not flood your history with duplicates. - Fields are created on the fly. If
valuescontains a field name the data source has not seen before, it is created automatically. Numeric-looking values become number fields, everything else becomes text. New names show up increated_fieldsin the response.
Error responses to handle:
| Status | Meaning |
|---|---|
403 |
The data source is disabled. |
404 |
Unknown ingest URL or data source slug |
422 |
Validation error, for example a non-numeric value pushed into a number field, a value over the size ceiling, or the per-source field cap reached |
429 |
Rate limited. Honor the Retry-After header before retrying |
401 |
Invalid or missing API token (authenticated endpoint only) |
Can you push values by email?
Yes. Every data source has a private inbound email address, shown in the app and returned as ingest_email when you create it. Email a value in the message body and PageCrawl records it exactly as if it had arrived through the API, which suits cron jobs, no-code tools, and systems that can only send email.
The address looks like data-a1b2c3d4e5f6g7h8i9j0k1l2@ingest.pagecrawl.io, and recording a value is one line from any box with a mail command:
echo "42" | mail data-a1b2c3d4e5f6g7h8i9j0k1l2@ingest.pagecrawl.ioParsing rules are simple:
- Lines in the body like
sentiment: positivethat match existing field names map to those fields. - Otherwise, the whole body is stored as the single value.
- If the body is empty, the subject line is used instead.
So a nightly report job that already emails "Backups completed: 14" somewhere can CC the ingest address (the handler reads the To, Cc, and Bcc lines) and the value is recorded and becomes alertable with no code changes. It is charted only when the data source has a number field for it. A fieldless source stores the whole email body as a single text value, which is not charted.
Note: the address itself is the credential. Anyone who knows it can send values into that data source, so keep it out of public repos and shared docs. For extra protection, set the optional sender filter (an exact address or an exact domain) so only mail from approved senders is accepted.
What happens after a value is received?
A received value is treated like the result of a page check. PageCrawl compares it with the previous value, stores it in the monitor's history, updates charts for numeric fields, and sends notifications through your configured channels shortly after a change is detected. AI summaries work on data sources too.
You can also read the current value straight back from the same secret URL with a GET (no token, no client library), which makes the URL a simple read/write key for a value:
curl https://pagecrawl.io/api/ingest/data-a1b2c3d4e5f6g7h8i9j0k1l2By default that returns just the latest value of each field; add ?history=20 for recent points. Reads do not count against your check allowance.
Concretely, every push or ingest email produces:
- A check record you can inspect later, including via
GETendpoints for monitor history. - Change detection against the last stored value, per field.
- Charts for number fields, so a pushed count or score builds a trend line over time.
- Notifications through any channel you have set up: email, Slack, Discord, Teams, Telegram, or webhooks. Notification rules (thresholds, increased, decreased, contains) apply the same way they do for pages.
- AI summaries and priority scoring, when enabled on the data source. This is where pushed text shines: raw changelog or status wording goes in, a readable summary of what moved and an importance score come out.
If you use AI assistants, the PageCrawl MCP server exposes two tools for this feature, create-data-source and record-data, and the existing read tools (latest values, monitor history) work on data sources like any other monitor. Any client that speaks the Model Context Protocol can therefore record a metric without touching curl.
Can you get scheduled summary reports of pushed data?
Yes. Data sources work with scheduled reports exactly like page monitors. Add them to a report by tag, folder, or by picking them individually, and you receive a daily, weekly, or monthly digest summarizing what changed across your pushed data, delivered to email, Slack, Discord, Teams, or Telegram.
Under the hood a data source is an ordinary monitor, so everything in scheduled reports applies to it. Each digest can open with an AI executive summary of the most important changes, and content filters let you set a minimum importance so a digest only lists pushes that mattered. Priority escalation covers the urgent cases: changes scoring above your threshold go out through separate channels without waiting for the next digest.
Monitors assigned to a report stop sending individual notifications and appear in the digest instead, which suits data sources that receive frequent pushes: a script can record values every few minutes while your team reads one consolidated summary each morning.
Example: watching a competitor's changelog with AI summaries
Suppose a competitor publishes release notes in a feed or an API rather than on a stable page you can monitor, which leaves a hole in your competitive intelligence monitoring. A short scheduled script can push each new entry as text, and PageCrawl's AI turns those raw pushes into readable change summaries and importance scores.
1. Create the data source. A single-value source named "Competitor changelog" is enough. The create response and the monitor's Send data panel both show its secret ingest URL.
2. Enable AI on it. Turn on AI summaries and priority scoring for the data source, the same toggles you would use on a page monitor. From then on, every changed push gets a plain-language summary of what is new and a score reflecting how significant it looks.
3. Write a small script that grabs the latest entry and pushes it:
import requests

INGEST_URL = "https://pagecrawl.io/api/ingest/data-a1b2c3d4e5f6g7h8i9j0k1l2"

entry = fetch_latest_changelog_entry()  # your feed reader or API call
requests.post(INGEST_URL, json={"value": entry})
4. Schedule it. A cron entry running every 30 minutes is plenty:
*/30 * * * * /usr/bin/python3 /opt/scripts/push_changelog.pyBecause unchanged text returns "changed": false and stores nothing, the schedule can be aggressive without polluting your history.
5. Connect Slack. Add a Slack notification channel to the data source in the app, using an incoming webhook from the Slack API. When a new entry is pushed, PageCrawl records the change and a Slack alert follows shortly after, with the AI summary up top, so you read "Added SSO support and raised API rate limits" instead of a wall of raw release notes. The priority score separates a major feature launch from a typo fix, and with escalation configured, high-scoring entries bypass your digest schedule.
The same pattern fits any pushed text: product descriptions from a supplier portal, status page incident wording, terms text from a partner API. And when the source also exposes a number, a version count or a mention count, push it as a second field in values and it gets its own chart.
Example: alerting on an internal KPI
The same pattern works for numbers that never leave your infrastructure, and numbers are where the charts earn their keep. Create a single-value data source called "Daily signups", then have your nightly reporting job push the count to its ingest URL:
curl -d value=148 https://pagecrawl.io/api/ingest/data-f4e5d6c7b8a9j0k1l2m3n4o5Each push extends the trend line, and a decreased notification rule means your team hears about a slowdown without anyone checking a dashboard. Since data sources are ordinary monitors, everything in the custom dashboards guide applies to them too: you can read their history back out through the API and plot pushed KPIs next to page changes. The developer guide covers webhooks and payload structure if you want changes flowing into your own systems.
Getting started
Data sources are available on every plan, including Free. To try one out:
- Create a data source from Settings > API > Data Sources (or
POST /api/data-sourceswith an API token). - Copy the ingest URL shown after creation, or later from the monitor's Send data panel.
- Run
curl -d value=42against that URL, then push a different value and watch the change appear in the app.
The interactive API reference documents both endpoints with schemas and example responses, and the push API help article walks through email ingestion and sender filters step by step. If you already monitor pages with PageCrawl, data sources fill in the gaps the crawler cannot reach, with the same history, charts, and alerts you already rely on.