Tomasz runs logistics for a mid-sized distributor that ships about 900 parcels a week domestically and brings in six or seven ocean containers a month from Asia. He builds his landed-cost model every quarter, and for two years it held up well. Then one month the parcel bill came in roughly four percent above his forecast with no change in volume, and the ocean invoice carried a peak season surcharge line he had never budgeted for.
Neither charge was a mistake. The parcel carrier had shifted its fuel surcharge table, which is published on a public web page and revised weekly. The ocean carrier had posted a rate announcement on its own newsroom weeks earlier, with an effective date that fell right in the middle of his shipping window. Both changes were visible to anyone reading the right pages on the right days. Tomasz was not reading them, because reading them means checking a dozen carrier pages every Monday morning forever.
That is the whole problem with freight cost changes. They are not secret and they are not sudden. They are published in advance on public pages, in tables and announcements that almost nobody re-reads, and they become expensive only because the news arrives on the invoice instead of during the quoting conversation. A shipper who sees a general rate increase two weeks before its effective date can pull bookings forward, push volume to a different carrier, or reprice a customer contract. A shipper who sees it on the invoice can only pay.
This guide covers which carrier pages carry the changing numbers, why carrier email advisories are not enough, and how to filter freight alerts down to the changes that touch your lanes.
Which freight pages actually show the changing numbers?
The pages worth monitoring are the ones that render the live value, not the marketing pages that describe it. For parcel, that is the carrier fuel surcharge table. For ocean, it is the carrier rate announcement feed and the trade surcharge finder. For the underlying index, it is the government fuel price series that most surcharge formulas reference.
Parcel fuel surcharge tables
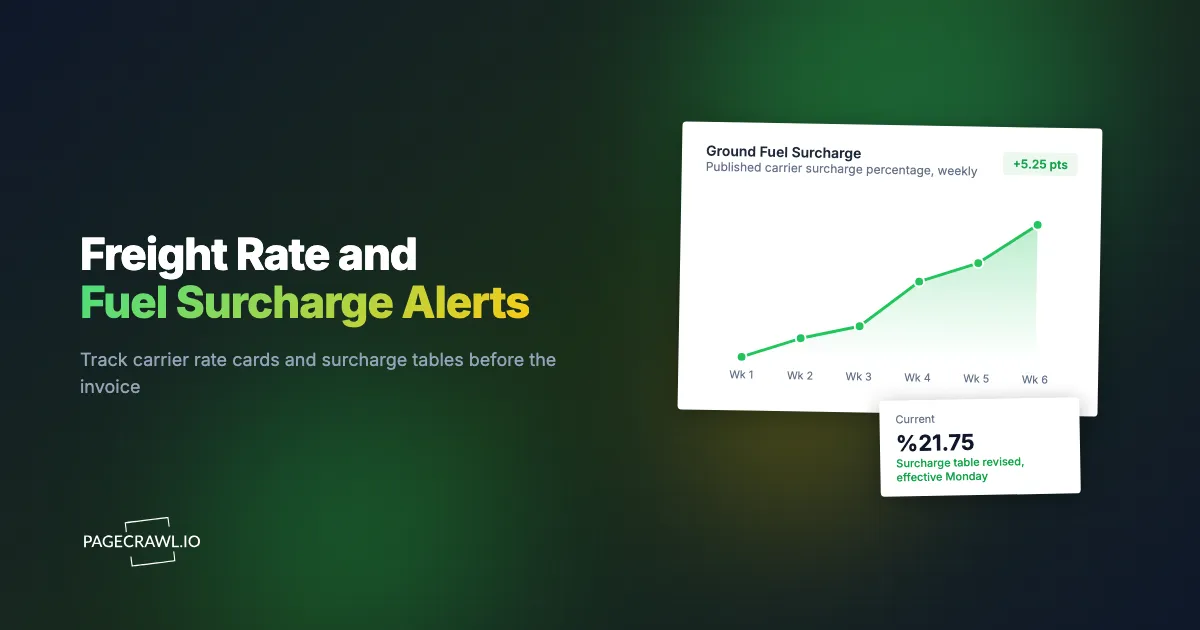
Both major US parcel carriers publish their fuel surcharge as a public percentage grid keyed to a fuel price band, and both revise it on a weekly cycle with changes effective on a Monday. FedEx publishes its weekly fuel surcharge tables broken out by service family, and UPS publishes its fuel surcharge page with the index-based percentages for ground, air and international services. Two things change on these pages: the current percentage for this week, which moves with fuel, and the table structure itself, which is how a carrier raises the effective surcharge without raising base rates. A table restructure is the expensive change and the easiest to miss, because the headline percentage can look unchanged while the entire band-to-percentage mapping has shifted underneath it.
Ocean rate announcements and surcharge finders
Ocean carriers publish forward-dated rate changes as news items. Maersk maintains a rate announcements category listing general rate increases, peak season surcharges and FAK adjustments by trade lane with their effective dates. Hapag-Lloyd publishes a trade surcharges overview alongside its ocean tariff pages, and CMA CGM keeps a price and surcharge updates news section. These are list pages: a new entry appearing is the signal. The value of monitoring them is lead time, since a GRI or peak season surcharge is typically announced days or weeks before the date it starts applying to sailings.
The underlying fuel index
Most surcharge formulas are not invented from nothing, they are pinned to a published fuel series. The US Energy Information Administration publishes weekly retail gasoline and diesel prices, including the national average on-highway diesel price that road and parcel surcharge tables commonly reference, and jet fuel spot prices that air services reference. Watching the index alongside the carrier table lets you see the increase coming a few days before the carrier page reflects it, and it lets you sanity-check whether a surcharge move actually tracked fuel or quietly outran it. If you also buy fuel directly for a private fleet, our guide to fuel and gas price monitoring covers watching retail and wholesale price pages the same way.
LTL and regional carrier pages
Less-than-truckload and regional parcel carriers publish their own surcharge schedules on a rates and tariffs page, on their own cadence rather than the national one. These pages are less standardized and far more likely to change without any announcement at all, which makes them among the highest-value pages a small logistics team can monitor.
Why isn't the carrier's own email advisory enough?
Carrier advisories go to whichever contact is on the account, they arrive per-lane and per-service in high volume, and they carry no filtering. Nothing in that stream tells you which announcement touches your lanes, your service mix, or your effective dates. Most teams stop reading them within a month, which is exactly when the expensive one arrives.
They go to one inbox and stay there
Rate advisories are addressed to the account contact, often a person who left, and forwarding rules rarely survive a reorganisation. The people who need the number are the pricing analyst building landed cost, the controller forecasting freight accrual, and the salesperson quoting a delivered price. A monitor pushing into a shared Slack or Teams channel reaches all three without depending on one mailbox.
There is no advisory for a table edit
An announced GRI usually gets an email. A revised fuel surcharge band table often does not, because from the carrier's perspective the mechanism was already disclosed in the published tariff and only the published numbers moved. That is precisely the change that lands on every single shipment you tender, which makes it the highest-value thing to watch and the least likely to be pushed to you.
Volume kills attention
A carrier operating dozens of trade lanes can post several rate announcements a week, nearly all irrelevant to you. Filtering matters more than receiving. A monitor that fires only when an announcement mentions your specific lane, port pair or service is a fundamentally different object from an inbox folder with 400 unread advisories in it.
What does a freight rate change actually cost you?
The cost is the gap between when the change takes effect and when your pricing reflects it, multiplied by every shipment tendered in that gap. A surcharge percentage applies to the base freight on every consignment, so a change of a couple of points is not a rounding error at volume, it is a direct margin transfer out of whatever you quoted.
Each lever moves on a different page with a different amount of notice, and each calls for a different response.
| Change type | Where it appears | Typical notice | What it hits |
|---|---|---|---|
| Weekly fuel surcharge percentage | Carrier fuel surcharge page | Days, effective Monday | Every shipment, as a percentage of base freight |
| Fuel surcharge table restructure | Same page, different bands | Often announced with the annual rate update | Every shipment, permanently |
| Annual general rate increase (parcel) | Carrier rate and service guide pages | Weeks to months | Base rates across services and zones |
| Accessorial and surcharge schedule | Rates and surcharges page or PDF tariff | Varies, sometimes none | Residential, oversize, remote area, address correction |
| Ocean GRI or FAK adjustment | Carrier rate announcement feed | Days to weeks | Per-container rate on a named trade lane |
| Peak season surcharge | Carrier rate announcement feed | Days to weeks | Per-container flat add-on during a defined window |
| Demurrage and detention tariff | Terminal or carrier tariff page | Varies | Containers dwelling past free time |
Note the inversion in that table. The changes with the least formal notice, table restructures and accessorial edits, apply to the largest share of shipments. The changes with the most notice, ocean GRIs and peak season surcharges, are where lead time converts into money, because a booking pulled forward past an effective date avoids the increase entirely.
Forecasting and quoting
Freight is accrued from a rate model, not from live carrier pages, so when the model and the tariff drift apart the gap surfaces at month end as unexplained overspend. Monitoring dates every change, which turns an accrual variance into a documented cause. The same applies on the sell side: if you quote delivered prices, every increase you did not know about is margin given away, the structural risk covered in our guide to free shipping thresholds and landed price monitoring.
How do you set up freight rate monitoring in PageCrawl?
Point a monitor at each carrier page that carries the number, choose a tracking mode that matches the page shape, check on a cadence tuned to that page's publication rhythm, and push alerts to the channel your team actually reads. A working setup for one parcel carrier plus one ocean carrier takes about ten minutes.
- Collect the URLs. Open each page in your browser and copy the exact URL you are looking at: the carrier fuel surcharge page, the carrier rate announcement or news feed, the trade surcharge or charge finder page for the lanes you buy, and the government fuel index page. If a surcharge lives inside a PDF tariff, copy the direct link to the document.
- Add each URL as a monitor. Create one monitor per page rather than a single catch-all, because you want to tell a fuel table change apart from a new GRI announcement without opening anything.
- Pick the tracking mode per page type. For a surcharge percentage grid, use specific text or specific number tracking scoped to the table so the alert names the value that moved. For an announcement list, use content tracking so a new entry appearing registers as a change. For a PDF tariff, use PDF extraction so revisions inside the document are compared as text rather than as a file.
- Set the check frequency to match the page. Weekly-cycle fuel tables justify a daily or a few-times-daily check clustered around the publication day, and there is nothing to gain from checking a weekly table every two minutes. Rate announcement feeds deserve a higher frequency during peak season and around quarter boundaries, when carriers file most heavily.
- Choose notification channels. Route freight alerts to email, Slack, Discord, Teams, Telegram, or a webhook into your own systems. Note: a shared channel beats a personal inbox here, because the pricing analyst, the controller and the account manager all need the same number on the same day.
- Add keyword and threshold rules. Filter announcement monitors on your lane and port names ("North Europe", "US West Coast", "Far East") so irrelevant trades stay silent, and put a numeric threshold on surcharge percentages so a fractional weekly tick does not fire while a material jump does. Our walkthrough of conditional alerts with price, keyword and threshold rules covers the exact configuration.
- Turn on screenshot capture. A dated screenshot of the surcharge table as it read on the day you quoted is the most useful artifact you can have in a billing dispute, and it accumulates passively.
- Push the change into your systems with a webhook. A webhook can drop the new percentage straight into a spreadsheet, a rate table, or a ticket, so the number that moved on the carrier page updates the model that prices your freight without anyone retyping it.
Alerts arrive when the next check detects the change, so the check interval is the real lever on how early you find out. On higher plans checks run within minutes of each other, which for a page that republishes weekly is more resolution than you need.
What should you monitor first if you only track a few pages?
Start with the pages that touch every shipment, then add lead-time pages, then add lane-specific ones. In practice that means one fuel surcharge table per carrier you use, one rate announcement feed per ocean carrier, and the fuel index. That is usually four to six monitors and it covers the majority of unexpected freight variance.
Tier 1: pages that price every shipment
Your primary parcel carrier's fuel surcharge table and its rates and surcharges page. These apply to one hundred percent of your parcel volume, they change on a published cycle, and a change of a point or two is material at any real volume. If you only ever set up two freight monitors, make them these.
Tier 2: pages that buy you lead time
Ocean carrier rate announcement feeds and peak season surcharge notices. The value here is not that the number changed, it is that you learn the effective date early enough to act on it: pull a booking forward, split volume, or renegotiate before the window opens. A GRI you learn about a week early is a decision. A GRI you learn about on the invoice is an expense.
Tier 3: pages that explain the others
The government fuel index, terminal demurrage and detention tariffs, and regional carrier schedules. These catch the long tail and let you answer the question a CFO always asks, which is whether the increase was driven by fuel or by the carrier, since you have both series dated side by side.
Where this sits in a wider supplier programme
The same pattern applies to component suppliers, packaging vendors and third-party logistics providers who publish rates or terms publicly. Our guide to supply chain monitoring across vendor websites covers extending the setup to the rest of the supplier base rather than treating freight as a special case.
What makes freight pages hard to monitor, and how do you handle it?
The three recurring difficulties are surcharge values buried in interactive lookup tools, tariffs published as PDF documents rather than web pages, and pages that change cosmetically every day without any pricing change. Each has a straightforward answer, and getting them right is the difference between a useful alert stream and one you mute.
Values behind a lookup tool
Some carriers expose rates through a search interface where you pick origin, destination and equipment before a number appears, and the resulting page may not have a stable URL. Monitor the published tariff or surcharge overview page the tool draws from, which is typically static, and use the lookup tool to confirm your specific lane after an alert fires. The monitor is a trigger, not a rate engine.
Tariffs published as PDFs
Many surcharge schedules, particularly for LTL and ocean accessorials, live in PDF documents that get silently replaced at the same URL. Monitoring these as documents rather than as files gives you a text diff showing which line item changed, not just a notice that the file differs. This is often the highest-yield monitor in a freight setup, precisely because a replaced PDF generates no announcement at all.
Cosmetic noise
Carrier pages carry timestamps, exchange rate tickers and rotating promotional panels that change constantly without any pricing meaning. Scope the monitor to the table or announcement region rather than the full page, and mark noisy regions ignored after the first few checks. A monitor that fires three times a day for nothing gets muted within a week, and a muted monitor catches nothing.
Effective dates versus announcement dates
An announcement dated today may apply to sailings six weeks out, while a fuel table published today takes effect on Monday. Capture the effective date, not just the fact of the change, and make it the field you act on. Log every alert against its effective date in the same calendar you use for pricing reviews, so a change announced in September that bites in November is not forgotten in October.
Choosing your PageCrawl plan
PageCrawl's Free plan lets you monitor 6 pages with 220 checks per month, which is enough to validate the approach on your most critical pages. Most teams graduate to a paid plan once they see the value.
| Plan | Price | Pages | Checks / month | Frequency |
|---|---|---|---|---|
| Free | $0 | 6 | 220 | every 60 min |
| Standard | $8/mo or $80/yr | 100 | 15,000 | every 15 min |
| Enterprise | $30/mo or $300/yr | 500 | 100,000 | every 5 min |
| Ultimate | $99/mo or $999/yr | 1,000 | 100,000 | every 2 min |
Annual billing saves two months across every paid tier. Enterprise and Ultimate scale up to 100x if you need thousands of pages or multi-team access.
In event-driven strategies, minutes matter. One actionable signal surfaced before the broader market reacts can return more than a year of Ultimate. Standard at $80/year covers the core IR, press, and filings pages for a handful of positions. Enterprise at $300/year scales to a full watchlist. All plans include the PageCrawl MCP Server, so you can ask Claude to summarize every material change across a company's IR, press, and filings over any period you care about and get the evidence pulled straight from your monitoring archive. AI assistants can create monitors through conversation on every plan, including Free. Ultimate at $999/year adds 2-minute frequency and web archiving, which matters if you need provable timestamps for a thesis.
Getting Started
Start with one page: the fuel surcharge table of the carrier that moves the most of your volume. Add it as a monitor, scope the tracking to the percentage grid rather than the whole page, and set it to check daily. That single monitor covers the charge that applies to every shipment you tender.
Then add three more: your ocean carrier's rate announcement feed with a keyword filter on your trade lanes, the government fuel index page for context, and whichever PDF tariff carries your accessorial schedule. Route all four into a shared Slack or Teams channel so pricing, finance and account management see the same number on the same day. Run it through one full billing cycle and compare your accrual against the dated alerts.
Stop discovering freight increases in accounts payable. Watch the pages that publish them.