Most companies check competitor websites the same way: someone remembers to look at a competitor's site, clicks around for ten minutes, reports "they changed their pricing page," and the team moves on. No framework. No documentation. No follow-up. The insight evaporates within a week.
Systematic competitor website analysis is one of the highest-ROI activities a business can perform, yet most organizations treat it as an occasional, informal exercise. Companies that analyze competitor websites methodically discover pricing opportunities, identify feature gaps, spot positioning weaknesses, and predict strategic moves months before they become obvious. The difference between "we check competitors sometimes" and "we have a competitor analysis program" is the difference between reacting and anticipating.
This guide covers a complete framework for analyzing competitor websites, the tools that make each analysis layer efficient, and how to turn one-time analysis into ongoing competitive intelligence.
Why Systematic Analysis Beats Ad Hoc Checking
The problem with casual competitor checking is not that it happens, but that it produces impressions instead of data. Someone visits a competitor's site, forms a subjective opinion, and shares it with the team. Next month, someone else visits and forms a different opinion. There is no baseline, no comparison, and no way to track changes over time.
Systematic analysis solves this by creating structured, repeatable assessments that produce comparable data points. When you analyze a competitor's pricing page using the same framework in January and June, you can identify exactly what changed, when it changed, and what the change implies about their strategy.
The Compounding Value of Ongoing Analysis
A single competitive analysis is useful but perishable. Markets move. Competitors evolve. The analysis you did six months ago may be dangerously outdated.
Ongoing analysis compounds because each new data point adds context to previous observations. A pricing increase in isolation might be meaningless. A pricing increase following a product simplification, a shift in messaging from SMB to Enterprise, and three enterprise-focused case studies tells a clear story: the competitor is moving upmarket.
This pattern recognition only works when analysis is consistent, documented, and tracked over time.
The 7-Layer Analysis Framework
Competitor websites reveal information across seven distinct dimensions. Analyzing each layer systematically ensures comprehensive coverage.
Layer 1: Positioning and Messaging
Positioning is the most strategic and often most revealing layer of competitor analysis. It answers the question: who does this company believe it serves, and why should those customers choose them?
What to examine:
- Homepage headline and subheading: The first thing visitors see reveals the core value proposition. Is the competitor leading with features, outcomes, price, or brand?
- Navigation structure: Menu labels indicate what the company considers most important. "Solutions" vs "Products" vs "Features" reflects different go-to-market approaches.
- Hero section CTAs: "Start Free Trial" vs "Book a Demo" vs "Get a Quote" reveals the sales model (self-serve, sales-assisted, enterprise).
- Customer logos and social proof: Which customers do they showcase? Enterprise logos suggest upmarket positioning. User counts suggest volume.
- Competitor comparison pages: If they have "Us vs Them" pages, these reveal exactly how they see the competitive landscape.
What to document: Primary value proposition, target customer description, key differentiators claimed, tone (technical vs accessible, enterprise vs startup, premium vs budget).
Analysis questions: How does their positioning compare to ours? Are they targeting the same segments? Where do they claim superiority? Where are they silent (possibly weak)?
Layer 2: Pricing and Packaging
Pricing pages are among the most frequently changed and most revealing pages on a competitor's website.
What to examine:
- Pricing tiers: How many tiers? What are the names? Naming convention reveals positioning (Starter/Pro/Enterprise vs Basic/Standard/Premium).
- Price points: Actual dollar amounts, annual vs monthly pricing, any hidden costs.
- Feature gating: Which features are available at which tiers? What are the upgrade triggers?
- Usage limits: User counts, API calls, storage, monitors, or whatever metric gates pricing.
- Enterprise pricing: "Contact us" suggests negotiated pricing. Transparent enterprise pricing is increasingly common.
- Free tier or trial: Free plan, free trial (with or without credit card), or demo-only indicates go-to-market strategy.
What to document: Full pricing table screenshot, per-tier feature lists, any promotional pricing, free tier details.
Analysis questions: Are they more or less expensive than us? What features do they gate that we include (or vice versa)? How do their usage limits compare? Is their packaging designed for similar customer segments?
For detailed pricing monitoring approaches, see our guide to competitor price tracking tools.
Layer 3: Features and Product
Feature analysis reveals product strategy and investment priorities.
What to examine:
- Feature pages: Detailed feature descriptions, screenshots, and demonstrations.
- Product tours or demos: Interactive demos reveal UX patterns and capabilities.
- Integrations page: Which integrations exist? Integration partners signal the target ecosystem.
- API documentation: API breadth and quality indicate the product's extensibility and developer focus.
- Changelog or What's New page: Recent changes reveal development velocity and investment areas.
- Roadmap page: Some companies publish public roadmaps showing future direction.
What to document: Complete feature list by category, notable capabilities we lack, notable gaps they have, integration ecosystem.
Analysis questions: What can they do that we cannot? What can we do that they cannot? Where are they investing development resources? Do their integrations serve the same customer ecosystem as ours?
Layer 4: Content Strategy
Content reveals marketing strategy, audience targeting, and thought leadership positioning.
What to examine:
- Blog: Topics, publishing frequency, content depth, author profiles (in-house vs guest). Content categories reveal which use cases and audiences they prioritize.
- Resource library: Whitepapers, guides, webinars, ebooks. These resources indicate which buying stages they are targeting (awareness vs consideration vs decision).
- Case studies: Customer stories reveal which verticals and use cases they serve. Case study structure (problem/solution/results) shows what outcomes they emphasize.
- Help documentation: Documentation quality and coverage indicates product maturity. Well-documented products suggest engineering investment.
- SEO targeting: What keywords are they ranking for? What topics are they creating content around? This reveals their SEO strategy and target search terms.
What to document: Content categories, publishing frequency, top-performing content (based on social shares or estimated traffic), content gaps.
Analysis questions: What topics do they cover that we do not? What audiences are they reaching through content? Are they investing more or less in content than we are?
For monitoring competitor content changes automatically, see our guide on tracking competitor websites.
Layer 5: Technology and Infrastructure
Technology choices reveal development priorities, target scale, and potential limitations.
What to examine:
- Page load speed: Test with Google PageSpeed Insights or WebPageTest. Slow sites suggest technical debt or low investment in performance.
- Mobile experience: Test on mobile devices. Mobile optimization reveals how seriously they take the mobile segment.
- CDN and hosting signals: Response headers and DNS records indicate infrastructure investment.
- Third-party tools: Marketing analytics, chat widgets, A/B testing tools, error tracking. These reveal marketing sophistication and tooling investment.
- Security indicators: SSL configuration, cookie policies, compliance badges (SOC 2, GDPR, HIPAA) indicate security maturity and target market requirements.
What to document: Key technology observations, performance benchmarks, notable third-party tools, security and compliance indicators.
Analysis questions: Is their technology stack more or less sophisticated than ours? Are they investing in performance? What compliance certifications do they have that we lack (or vice versa)?
Layer 6: User Experience and Design
UX analysis reveals how the competitor thinks about user journeys and conversion.
What to examine:
- Sign-up flow: How many steps? What information required? Friction level (credit card required, email verification, demo booking).
- Onboarding: If a free trial is available, sign up and evaluate the onboarding experience. First-run experience reveals product maturity.
- Navigation patterns: How do they structure information? Can users find what they need quickly?
- Visual design quality: Professional design suggests investment in brand and user experience. Dated design may indicate resource constraints.
- Accessibility: Basic accessibility compliance (alt text, keyboard navigation, color contrast) indicates development maturity.
What to document: Sign-up friction level, onboarding quality, navigation structure, design quality assessment, accessibility observations.
Analysis questions: Is their user experience better or worse than ours? Where are the friction points in their conversion funnel? What UX patterns could we adopt?
Layer 7: SEO and Organic Visibility
SEO analysis reveals which terms competitors are targeting and how successfully they capture search traffic.
What to examine:
- Organic keyword rankings: Tools like Ahrefs, Semrush, or Moz show which keywords a competitor ranks for.
- Content gap analysis: Keywords your competitors rank for that you do not.
- Backlink profile: Quality and quantity of inbound links indicates domain authority and link-building strategy.
- Technical SEO: Site structure, URL patterns, schema markup, sitemap quality.
- Page title and meta patterns: How competitors structure titles and descriptions reveals their SEO targeting strategy.
What to document: Top ranking keywords, estimated organic traffic, key content gaps, backlink quality assessment.
Analysis questions: Which valuable keywords do they rank for that we do not? What content should we create to close the gap? Is their SEO strategy focused on branded or non-branded terms?
For ongoing SEO monitoring, see our dedicated SEO monitoring guide.
How to Document Findings
Analysis is only valuable if it is documented in a way that enables comparison over time and distribution across teams.
Create a Competitor Profile Template
Build a standardized template covering all seven layers. Use the same template for every competitor so findings are directly comparable. The template should include:
- Last updated date: Analysis decays quickly. Knowing when data was collected is essential.
- Analyst name: Different analysts may interpret the same data differently. Attribution helps resolve contradictions.
- Evidence links: Screenshots, URLs, and specific observations rather than subjective impressions.
- Change log: What changed since the last analysis? This section becomes the most valuable over time.
Maintain a Comparison Matrix
Create a spreadsheet or table that compares key attributes across all competitors. Include your own company for reference. This matrix surfaces patterns that individual profiles miss.
Example matrix rows: pricing (lowest tier), pricing (enterprise), free trial availability, feature count, integration count, content publishing frequency, estimated organic traffic, mobile experience quality.
Update the matrix when any competitor's data changes. Over months, the matrix tells the story of competitive evolution.
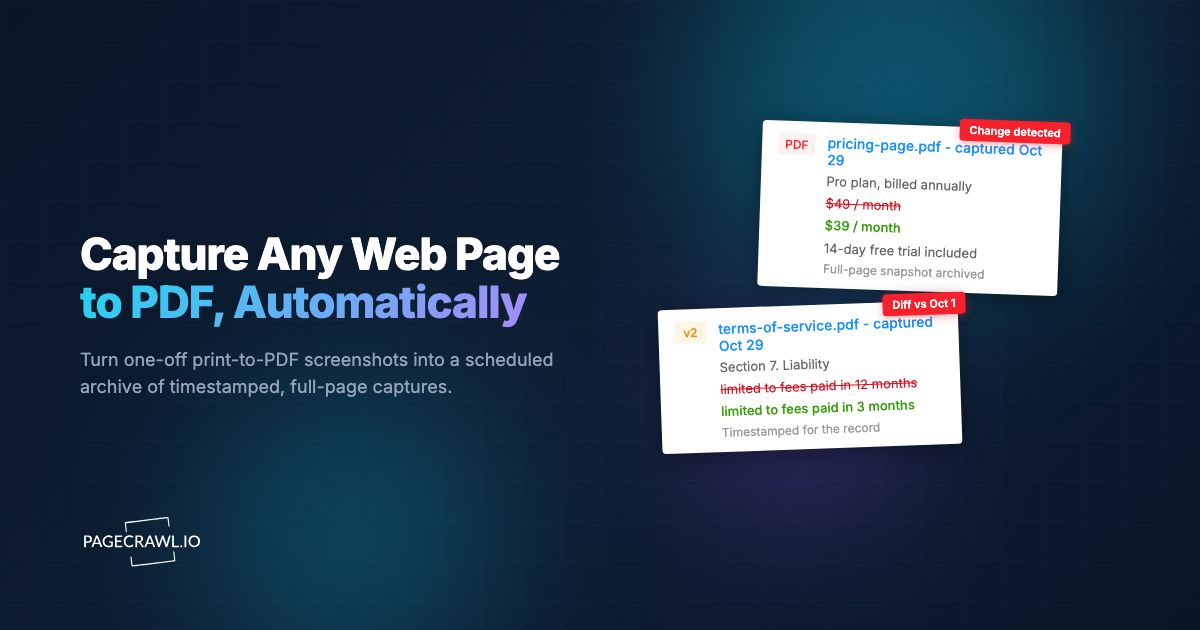
Archive Screenshots and Evidence
Competitor websites change. A screenshot from today might be the only record of a pricing page that changes next week. Systematically archive key pages during each analysis cycle. PageCrawl's website archiving capabilities can automate this process.
Tools for Each Analysis Layer
Different layers benefit from different tools.
| Layer | Manual Review | Automated Monitoring | Specialized Tools |
|---|---|---|---|
| Positioning | Website visit, screenshot | PageCrawl (homepage, about page) | None needed |
| Pricing | Pricing page review | PageCrawl (pricing page monitoring) | Price2Spy, Prisync |
| Features | Feature page review, trial signup | PageCrawl (changelog, feature pages) | G2, Capterra for comparison |
| Content | Blog review, content audit | PageCrawl (blog page monitoring) | Ahrefs, Semrush for SEO data |
| Technology | PageSpeed, mobile testing | PageCrawl (performance monitoring) | BuiltWith, Wappalyzer |
| UX | Manual testing, sign-up | PageCrawl (sign-up page changes) | Hotjar (your own site only) |
| SEO | Keyword research | PageCrawl (SERP monitoring) | Ahrefs, Semrush, Moz |
Using PageCrawl for Ongoing Competitor Tracking
One-time analysis provides a snapshot. Ongoing monitoring turns snapshots into a movie, revealing competitive dynamics as they unfold.
Monitor Key Competitor Pages
Set up PageCrawl monitors on the pages that change most frequently and reveal the most strategic information:
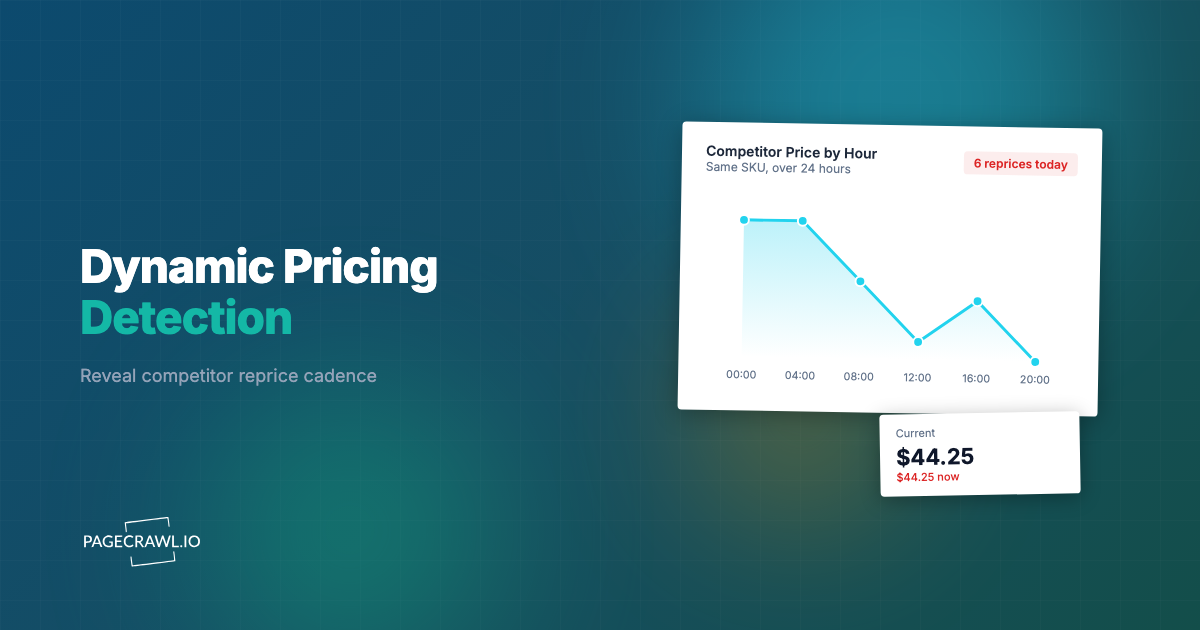
- Pricing page: Any change to pricing or packaging is a strategic signal. Monitor every competitor's pricing page.
- Homepage: Messaging changes reflect positioning shifts. Homepage hero section changes are particularly significant.
- Feature pages: New features, removed features, and reorganized feature pages all signal product strategy.
- Blog/changelog: New content and product updates reveal investment priorities.
- Careers page: Hiring patterns signal expansion areas. A competitor suddenly posting 10 sales roles indicates go-to-market investment.
For each monitor, use the tracking mode that best fits the page type. "Content Only" or "Reader" modes work well for blogs and changelogs. "Full Page" mode captures everything on pricing and feature pages.
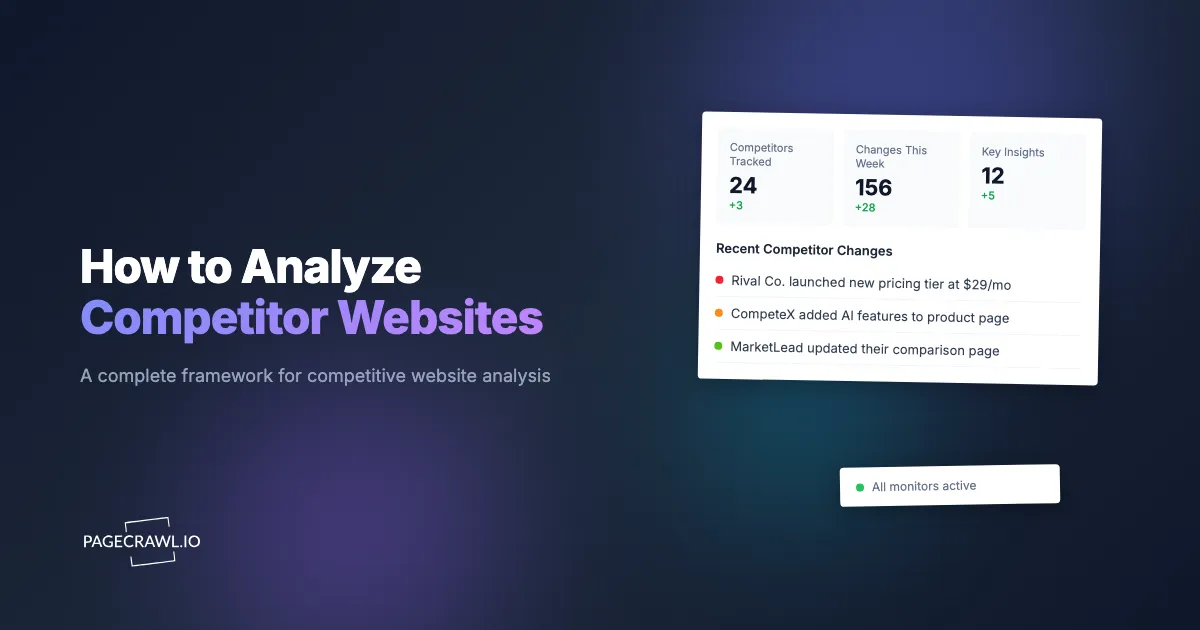
AI Summaries for Change Detection
PageCrawl's AI-powered change summaries are particularly valuable for competitor monitoring. Instead of reviewing raw diffs, you receive natural language summaries like "Added Enterprise tier with SSO and audit logs, priced at $499/month" or "Removed free tier, replaced with 14-day free trial."
These summaries make it easy to scan changes across many competitors quickly and identify the ones that require deeper analysis.
PageCrawl's review boards give your team a shared workspace for triaging competitor changes. When a change is detected, it appears on the review board where team members can mark it as reviewed, flag it for follow-up, or dismiss it. This prevents the common problem where multiple people see the same alert but nobody acts on it, or one person investigates a change that another team member already assessed.
Building a Competitor Monitoring Dashboard
Create folders in PageCrawl for each competitor. Within each folder, add monitors for key pages. Configure notifications for the team:
- Weekly digest email: Summary of all competitor changes for the week
- Instant Slack alerts: Critical pages (pricing, homepage) trigger immediate team notification
- Webhook for CRM integration: Feed competitor changes into your CRM or competitive intelligence database
For detailed instructions on building monitoring dashboards, see our dashboard building guide.
Building a Competitor Analysis Cadence
Effective competitor analysis is not a one-time project. It requires a regular cadence adapted to your market's pace.
Weekly Reviews
Spend 15-30 minutes per week reviewing automated monitoring alerts from PageCrawl. Identify which competitor changes warrant deeper investigation. Update the comparison matrix with any new data points.
This is the minimum viable cadence. Weekly reviews ensure nothing significant goes unnoticed.
Monthly Deep Dives
Once per month, select one competitor for a comprehensive analysis using the 7-layer framework. Rotate through competitors so each receives a deep dive every quarter (for markets with 3-4 primary competitors).
Document findings in the competitor profile template. Compare against the previous deep dive to identify trends and changes.
Quarterly Strategic Reviews
Every quarter, convene a cross-functional meeting (product, marketing, sales, leadership) to review the competitive landscape. Present the comparison matrix, highlight significant changes from the quarter, and discuss strategic implications.
Use this meeting to decide: Should we adjust pricing? Should we accelerate certain features? Should we change our messaging? Should we target different segments?
Annual Competitive Landscape Report
Once per year, compile a comprehensive competitive landscape report covering all competitors, market trends, and strategic recommendations. This report serves as the baseline for the next year's monitoring and analysis.
Turning Analysis into Action
Analysis without action is academic. Here is how to translate competitive insights into strategic decisions.
Positioning Adjustments
If analysis reveals that competitors are converging on similar messaging, look for differentiation opportunities. If competitors are moving upmarket, there may be an underserved SMB segment. If competitors are emphasizing certain features, consider whether your messaging adequately addresses the same capabilities or superior alternatives.
Feature Roadmap Input
Competitive feature analysis should feed directly into product planning. This does not mean copying competitors. It means understanding where the market is heading, identifying table-stakes features you lack, and finding opportunities where competitor weaknesses align with your strengths.
Pricing Strategy
Pricing analysis reveals market positioning and customer willingness to pay. If all competitors are priced higher, you may be leaving money on the table. If competitors are cutting prices, a price war may be developing. If competitors are adding tiers, the market may be segmenting.
Use pricing analysis alongside customer feedback and usage data to inform your own pricing decisions.
Content Strategy
Content gap analysis reveals SEO opportunities and audience segments competitors are reaching that you are not. Create content plans that address the most valuable gaps while reinforcing your existing strengths.
Sales Enablement
Competitive analysis produces ammunition for sales conversations. When prospects mention a competitor, your sales team should have current, specific talking points about positioning, pricing, feature differences, and weaknesses. Keep a competitive battle card updated with findings from ongoing analysis.
Common Mistakes to Avoid
Analyzing Too Many Competitors
Focus on 3-5 primary competitors rather than monitoring every company in your space. Deep analysis of a few competitors produces more value than shallow analysis of many.
Confusing Activity with Insight
Tracking competitor changes is not the same as generating competitive intelligence. Intelligence requires interpretation. "Competitor X changed their homepage headline" is a data point. "Competitor X shifted messaging from technical features to business outcomes, suggesting they are targeting a less technical buyer persona" is intelligence.
Ignoring Indirect Competitors
Direct competitors sell similar products to similar customers. Indirect competitors solve the same problem differently. A competitor analysis program that ignores indirect competitors misses threats from adjacent categories.
Analysis Paralysis
Do not wait for perfect data before acting. Competitive analysis is inherently incomplete because you can only see what competitors make public. Make decisions based on available evidence and update as new data arrives.
Over-Reacting to Single Changes
One pricing change or messaging update does not necessarily indicate a strategic shift. Look for patterns across multiple changes before drawing strategic conclusions.
Choosing your PageCrawl plan
PageCrawl's Free plan lets you monitor 6 pages with 220 checks per month, which is enough to validate the approach on your most critical pages. Most teams graduate to a paid plan once they see the value.
| Plan | Price | Pages | Checks / month | Frequency |
|---|---|---|---|---|
| Free | $0 | 6 | 220 | every 60 min |
| Standard | $8/mo or $80/yr | 100 | 15,000 | every 15 min |
| Enterprise | $30/mo or $300/yr | 500 | 100,000 | every 5 min |
| Ultimate | $99/mo or $999/yr | 1,000 | 100,000 | every 2 min |
Annual billing saves two months across every paid tier. Enterprise and Ultimate scale up to 100x if you need thousands of pages or multi-team access.
Standard at $80/year pays for itself the first time your sales team spots a competitor pricing change before a prospect does. 100 monitored pages is enough to run a thorough analysis program across three to five direct competitors, covering their pricing pages, feature pages, homepage messaging, and blog. Enterprise at $300/year scales to 500 pages for broader competitive landscapes, adds SSO, and supports checks as often as every 5 minutes.
All plans include the PageCrawl MCP Server, which plugs directly into Claude, Cursor, and other MCP-compatible tools. Your team can ask "what has Competitor X changed on their pricing page this quarter?" and get an answer drawn from your own monitoring archive, turning tracked pages into a searchable competitor intelligence database rather than a stream of alerts. AI assistants can create monitors through conversation on every plan, including Free.
Getting Started
Choose your top 3 direct competitors. Spend one hour per competitor performing the 7-layer analysis described above. Document findings in a standardized template. Create a comparison matrix covering key attributes.
Then set up ongoing monitoring. Create PageCrawl monitors for each competitor's pricing page, homepage, and blog. Configure weekly notification digests so changes surface automatically rather than requiring manual checks.
PageCrawl's free tier includes 6 monitors, enough to track the most critical pages of 2-3 competitors and establish an ongoing monitoring habit. As your competitive intelligence program matures, paid plans at $80/year for 100 monitors (Standard) or $300/year for 500 monitors (Enterprise) provide room to scale across more competitors, more pages, and more analysis dimensions.
The companies that win are not the ones with the best competitors. They are the ones that understand their competitors best. Start building that understanding today.