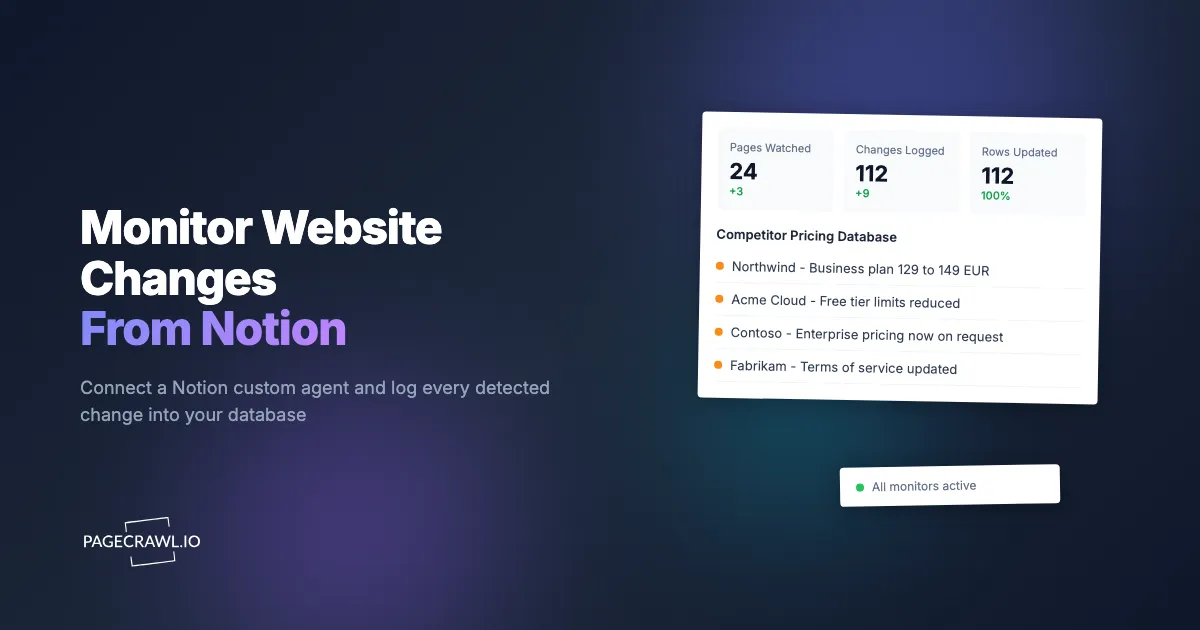
Most teams already keep their competitive research, vendor list and launch notes in Notion. The page monitoring lives somewhere else, so the interesting part (something changed) arrives in an inbox and never makes it back into the doc where the decision gets made.
Notion custom agents can call an external MCP (Model Context Protocol) server, and PageCrawl runs one. Connect the two and the agent can create monitors, read what changed, and write the result straight into a Notion database, without you leaving Notion or building an integration.
This guide covers the connection itself, then a full worked example: a competitor pricing log that maintains itself.
What does connecting PageCrawl to Notion actually give you?
Your Notion agent gains the ability to watch any public web page and to read what changed on the pages it already watches. Because it is a Notion agent, it can also write those results into your own databases. The monitoring runs on PageCrawl's schedule whether or not anyone is in Notion.
That last point is the one worth sitting with. The agent is not sitting in a loop refreshing pages. PageCrawl checks on the schedule you set, records what changed, and the agent reads the accumulated results whenever you or a Notion automation asks it to.
How do you connect PageCrawl to a Notion custom agent?
Three steps, all in Notion, and you need to be a workspace admin for the first one.
1. Turn on custom MCP connections
In Notion, open Settings, then Connections, and enable custom MCP servers for the workspace. Notion documents this in MCP connections for Custom Agents. Until this is on, the option to add your own server is hidden.
2. Add the PageCrawl server
Choose Add connection, then Add custom MCP, and fill in:
| Field | Value |
|---|---|
| MCP server URL | https://mcp.pagecrawl.io/mcp |
| Name | PageCrawl |
| Authentication | OAuth |
There is no API key to paste. Notion registers itself with PageCrawl automatically and the scope it requests is mcp:use, which is the only scope this connection can ever hold.
3. Approve the connection
Click Connect. Notion sends you to PageCrawl to sign in and approve. The approval screen names the application and shows exactly where you will be sent back to, so read it before approving, the same as you would for any OAuth connection. Once approved, the tools appear to your agent.
Note: Notion will warn you that it has not reviewed the server. That warning appears for every custom MCP connection, including ones you host yourself. It reflects who published the connector, not whether it is working correctly.
Worked example: a self-maintaining competitor pricing log
The setup below took one conversation. The scenario: three competitors, their pricing pages, and a Notion database that should always show what each of them charges and when it last moved.
Step 1: create the Notion database first
Make a database with these properties. The agent fills them in, so the names matter more than the order.
| Property | Type | What goes in it |
|---|---|---|
| Competitor | Title | Company name |
| Page | URL | The page being watched |
| Current price | Text | Value captured on the last check |
| Previous price | Text | What it was before |
| Changed on | Date | When the change was detected |
| Summary | Text | What actually changed |
Step 2: ask the agent to set up the monitoring
Watch the pricing pages for these three companies and track the price on each:
https://slack.com/pricing,https://www.notion.com/pricing,https://linear.app/pricing. Check them daily. Then add a row to my Competitor Pricing database for each one.
The agent calls add-page-monitor once per URL with a price tracking mode, which captures the number rather than the whole page. That matters for what comes later: a numeric value gives you a real history you can chart and compare, where full page text would only tell you that something on the page moved.
Creating a monitor queues its first check, so the captured value comes back on its own. The agent reads it with get-latest-values and fills in the Current price column.
Step 3: ask it to log changes on a schedule
Every Monday, check what changed on my monitored pricing pages in the last week and update the Competitor Pricing database. Put the old value in Previous price, the new one in Current price, set Changed on, and write one sentence in Summary.
Here the agent calls get-changes-since with a one week window. That returns only the checks where something actually changed, with the captured values and a short summary of each. It then updates your rows.
Run it from a Notion automation or ask for it by hand. Either way the database stops being a thing somebody has to remember to update.
Step 4: ask questions of the history
Once a few weeks of history exist, the agent can answer from it directly:
Which of my monitored competitors changed pricing most often this quarter, and what was the biggest single move?
That is get-monitor-history and get-statistics doing the work. The answer comes from recorded checks, not from the agent re-reading the pages.
Which PageCrawl tools can a Notion agent use?
All of them, on every plan including Free. The agent can create monitors (add-page-monitor), list and search them, read history and diffs (get-monitor-history, get-check-diff), pull recent changes (get-changes-since), fetch stored screenshots, edit or delete monitors (manage-monitors), organise them with folders and tags, and mark changes as reviewed.
Two things are deliberately out of reach. Site logins can be listed but never created or read through the connection, so credentials stay in the dashboard where you set them up. And the connection cannot reach the rest of the PageCrawl API: the scope is fixed at mcp:use no matter what a client asks for.
How is this different from a Zapier or Make automation?
The automation platforms move data on a fixed path you draw in advance: when a change arrives, put these fields in that database. A Notion agent decides what to do at the time, so it can set up new monitoring mid-conversation, summarise a change in your own words, and write it wherever it belongs.
Neither is better. Wire up a webhook through an automation platform when you want the same thing to happen every time without variance. Use a Notion agent when the useful part is judgement: which of these matter, what should the row actually say, is this worth telling the team.
What do you do when the agent captures the wrong value?
Ask it to look at the monitor, not the page. get-monitor-details shows what the monitor is configured to track and get-check-diff shows what the last check actually captured, which is usually enough to see whether the wrong element was picked up. If it is not obvious why, the agent can re-run the configuration against the live page with test-configuration and report what it would capture now.
The usual cause is a tracking mode that is too broad. A page that mixes a price with a countdown timer or a rotating banner will report a change every check if the whole page is being watched. Narrowing it to the price alone fixes it.
How often does PageCrawl check the pages?
You set the frequency per monitor, and the agent can change it later by asking. Alerts and database updates reflect what the most recent check found, so a page checked daily surfaces a change on the next daily check rather than when it happens on the site.
Pick the interval from how fast the page actually moves. A pricing page that changes a few times a year does not need to be checked every few minutes, and a monitor that runs more often than the page changes mostly produces noise for the agent to filter back out.
Do you need an agent for this at all?
No. There are two ways to get website changes into Notion, and they suit different jobs.
A custom agent, the subject of this guide, decides what to do at the time. It can set up new monitoring mid-conversation, judge which changes matter, and write a row in your own words. It needs a Notion plan that includes custom agents.
Direct sync is the other way round: PageCrawl writes the row itself, on its own schedule, with no agent involved. You connect Notion once in PageCrawl's settings, pick a database (or several, each fed by a folder, a tag or a website), choose which fields become properties, and every detected change lands as a row. Nothing has to be asked for, and there is no AI in the path. See syncing changes to a Notion database for the setup.
Use the agent when the value is judgement. Use direct sync when the value is a complete, reliable record. They can both run at once.
Where to go next
The same connection works in Claude, ChatGPT, Cursor and any other MCP client, so the monitors you create from Notion are the same monitors you can ask about anywhere else. The MCP server overview covers the other clients, and the setup walkthrough goes through the connection flow step by step.
If you would rather push changes into Notion through an automation platform instead of an agent, the webhook guide covers the payload and the fields available on it.