Modern software teams deploy code multiple times per day. With deployments happening that frequently, keeping track of what is running where becomes a challenge. Status pages go red, builds fail silently in queues, and production deployments complete without the right people knowing.
CI/CD pipeline monitoring goes beyond the built-in notifications from tools like GitHub Actions, GitLab CI, or Jenkins. It means tracking the actual status pages, deployment dashboards, and release logs that tell you the real state of your systems, and getting alerts through channels your team actually watches.
This guide covers how to monitor CI/CD pipelines, deployment status pages, and release workflows using automated change detection.
Why Built-In CI/CD Notifications Fall Short
Most CI/CD platforms offer email notifications or webhook integrations. These work for basic cases, but they have limitations:
Notification overload: When every commit triggers a pipeline, built-in notifications generate constant noise. Teams learn to ignore the flood of "build passed" messages, which means they also miss the "build failed" ones.
Limited channels: Many CI/CD tools only support email and webhooks natively. If your team communicates on Slack, Discord, or Teams, you need additional integration work to route alerts there.
No cross-platform visibility: Teams using multiple CI/CD tools (GitHub Actions for one project, Jenkins for another, ArgoCD for Kubernetes deployments) cannot get a unified view from any single tool's notification system.
Missing context: A notification that says "build failed" does not tell you whether the failure is new, intermittent, or has been failing for the last 20 commits. Change detection provides that context.
Status page blindness: Your hosting provider's status page, your CDN's status page, and your database provider's status page all require manual checking. Nobody monitors these until something is already broken.

What to Monitor in CI/CD Pipelines
Deployment Status Pages
Most infrastructure providers maintain status pages that report the health of their services:
- Cloud providers: AWS Health Dashboard, Google Cloud Status, Azure Status
- Hosting platforms: Vercel Status, Netlify Status, Heroku Status
- Databases: PlanetScale Status, Supabase Status, MongoDB Atlas Status
- CDNs: Cloudflare System Status, Fastly Status
- CI/CD platforms: GitHub Status, GitLab Status, CircleCI Status
These pages change when incidents occur. Monitoring them means you know about outages the moment they are reported, not when your users start complaining.
Build and Pipeline Dashboards
CI/CD dashboards show the current state of your pipelines. Key elements to track:
- Build status badges: The pass/fail indicator on your repository or dashboard
- Pipeline duration trends: Sudden increases in build time can indicate infrastructure issues
- Queue length: How many builds are waiting to run
- Deployment logs: The latest deployment output for each environment
Release and Changelog Pages
Many teams publish release notes or changelogs that indicate what version is currently deployed:
- GitHub Releases page: Tracks tagged releases with notes
- Internal release dashboards: Custom pages showing current deployed versions
- Changelog files: Public changelog pages that update with each release
- Version endpoints: API endpoints that return the current application version
Dependency and Security Pages
Monitor pages that affect your deployment pipeline:
- npm registry status: Outages here block JavaScript builds
- Docker Hub status: Container builds depend on this
- GitHub API status: Automated workflows that use the GitHub API fail when it is down
- Security advisory pages: New CVEs that affect your dependencies. For a broader view, see our guide to API monitoring and change alerts
Setting Up CI/CD Monitoring
Monitor Provider Status Pages
For each infrastructure provider you depend on, set up a monitor on their status page.
Step 1: Identify all status pages relevant to your stack. A typical web application might depend on:
- Hosting provider status (e.g., Vercel, AWS)
- Database provider status (e.g., PlanetScale, RDS)
- CI/CD platform status (e.g., GitHub Actions)
- CDN status (e.g., Cloudflare)
- DNS provider status
Step 2: Create a monitor for each status page. Use full page text monitoring to catch any change, including new incidents, resolved incidents, and maintenance notices.
Step 3: Set check frequency to every 15-30 minutes. Status pages do not change frequently, so aggressive checking is not necessary.
Step 4: Route alerts to your team's incident channel on Slack or Discord so the right people see them immediately.
Monitor Build Status Badges
Many projects display build status badges (usually hosted by services like shields.io or the CI platform itself). These SVG images change between "passing" and "failing" states.
To monitor these with a text-based approach:
- Find the badge URL for your CI pipeline
- Monitor the JSON endpoint that backs the badge (most badge services have one)
- Set up alerts for when the status changes from "passing" to anything else
Alternatively, monitor your CI platform's web dashboard directly by targeting the status element using a CSS selector.
Monitor Version Endpoints
If your application exposes a version or health endpoint, monitor it to confirm deployments succeed:
https://api.yourapp.com/health
https://api.yourapp.com/version
Track the text content of this endpoint. When a deployment completes, the version number changes, confirming the deployment went through. If the version does not change after an expected deployment, something may have gone wrong.
Monitor Release Pages
Track your project's release page to get notified when new versions are published:
- GitHub:
https://github.com/org/repo/releases - GitLab:
https://gitlab.com/org/repo/-/releases - npm:
https://www.npmjs.com/package/package-name
This is especially useful for monitoring dependencies. When a critical library publishes a new release (especially a security patch), you want to know immediately. You can also monitor REST APIs for breaking changes as part of your dependency tracking.
Monitoring Strategies for Different Team Sizes
Small Teams (2-5 developers)
Focus on monitoring the essentials:
- Your hosting provider's status page
- Your CI/CD platform's status page
- Your production health endpoint
- One or two critical dependency release pages
Alert to a shared Slack channel. With a small team, everyone should see infrastructure alerts.
Medium Teams (5-20 developers)
Add environment-specific monitoring:
- Separate monitors for staging and production status
- Monitor each major infrastructure provider status page
- Track deployment frequency (monitor the deployments page)
- Monitor internal dashboards for key metrics
- Set up different alert channels for different severity levels
Large Teams (20+ developers)
Implement comprehensive monitoring:
- Monitor all infrastructure provider status pages
- Track build queues and pipeline durations
- Monitor internal deployment dashboards
- Set up tiered alerting (critical to on-call, informational to general channel)
- Monitor compliance and security advisory pages
- Track SLA pages for your vendors
Integrating with Existing DevOps Workflows
Slack Integration
Route CI/CD monitoring alerts to dedicated Slack channels:
#infrastructure-alerts: Provider status page changes#deployments: New deployment notifications from monitoring version endpoints#dependency-updates: New releases from monitored dependency pages
This provides a permanent, searchable record of infrastructure events alongside your team's discussions about them.
Incident Response
When a monitoring alert fires for a provider status page:
- The team sees the alert in their incident channel
- They can immediately check if the incident affects their services
- They can proactively communicate to users before complaints arrive
- They can track the resolution by watching for further status page changes
This is significantly faster than discovering outages through user reports or manually checking status pages.
Post-Deployment Verification
After triggering a deployment:
- Monitor your version endpoint. When it changes, the deployment is confirmed.
- If the endpoint does not change within the expected window, investigate.
- Monitor your error tracking service's dashboard page for a spike in errors following the deployment. Consider adding visual regression monitoring as an additional post-deployment check to catch UI breakage.
What Changes to Watch For
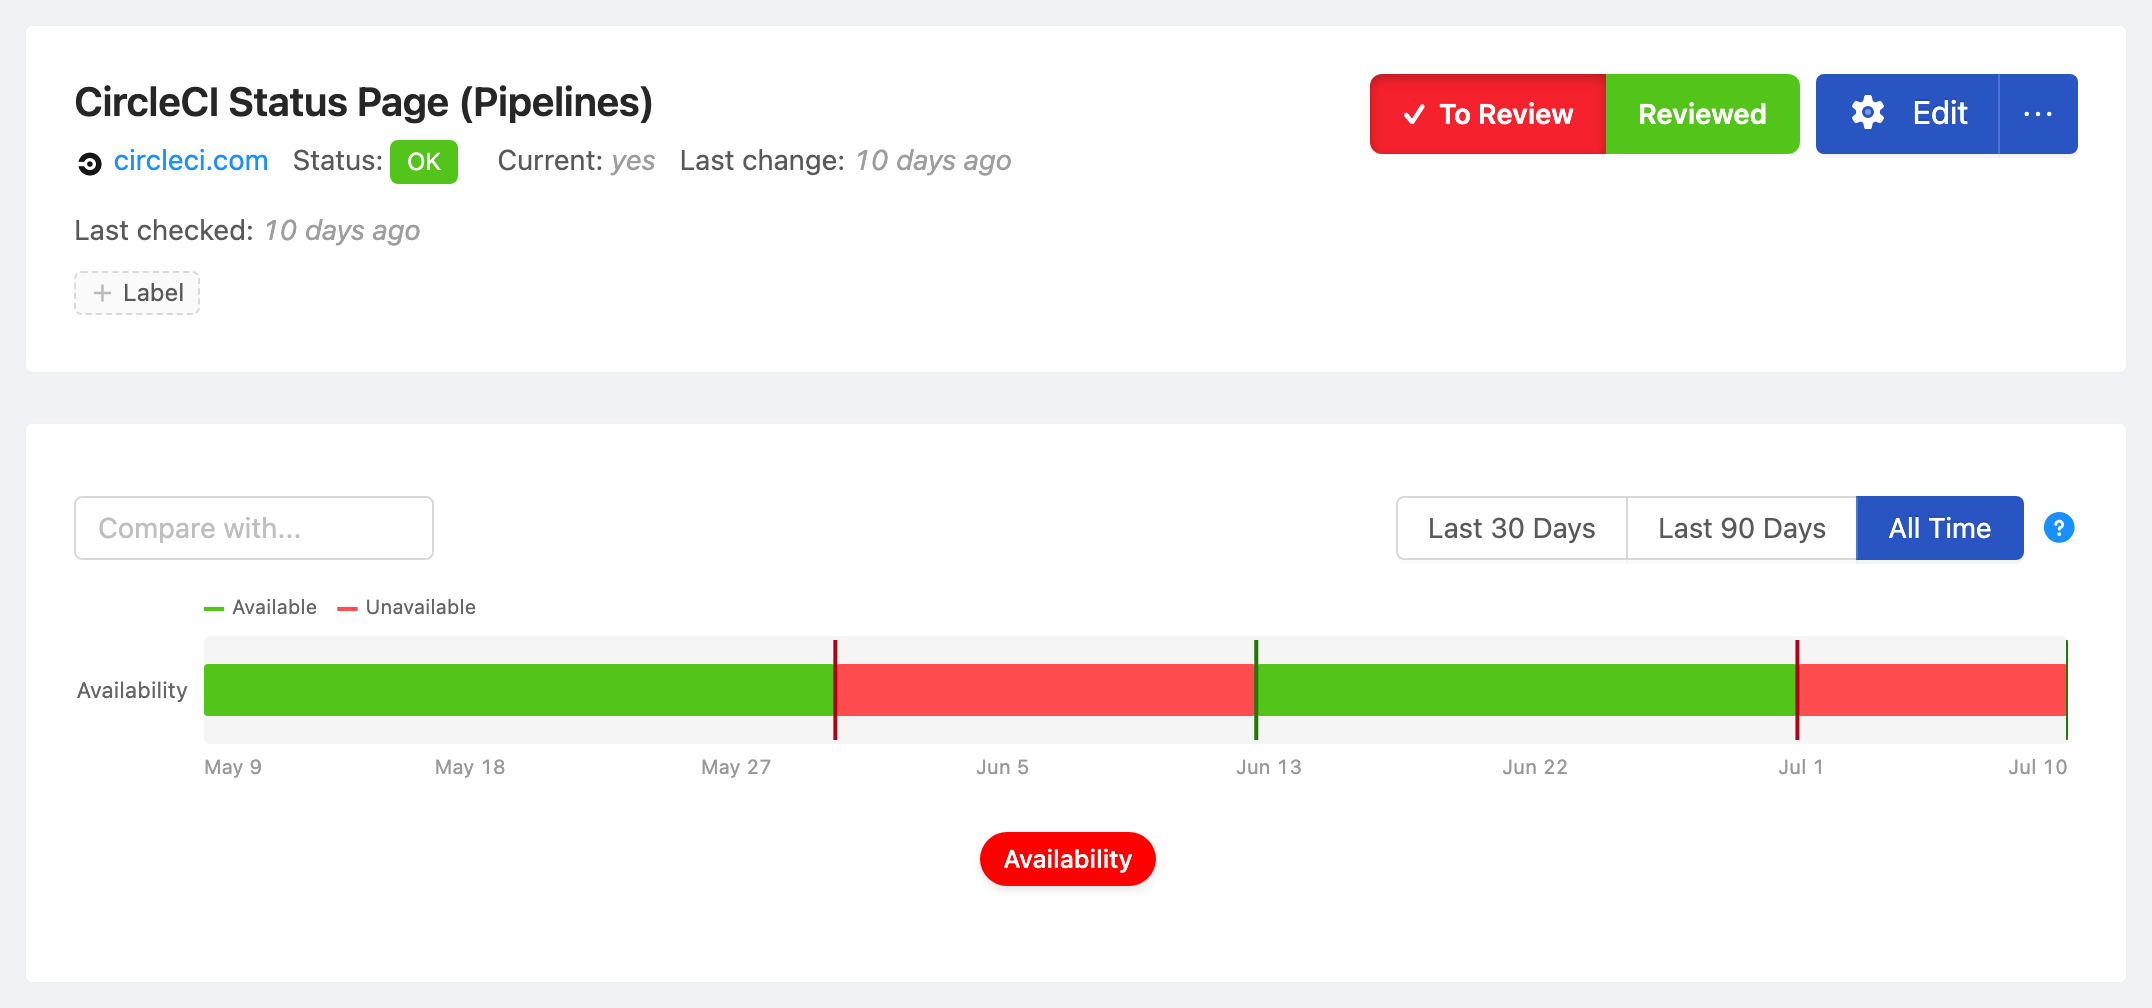
Status Page Changes
Status pages follow a predictable pattern:
- "All Systems Operational" changes to "Investigating" or "Identified": Something is wrong
- "Identified" changes to "Monitoring": The fix is deployed, they are watching
- "Monitoring" changes to "Resolved": The incident is over
Any of these transitions is worth an alert.
Build Dashboard Changes
Watch for:
- Status changing from green/passing to red/failing
- New error messages appearing in build output
- Build time increasing significantly (could indicate resource issues)
- Queue length growing (CI/CD platform may be under load)
Deployment Log Changes
Key changes in deployment logs:
- New deployment entries (confirm a deployment happened)
- Rollback entries (something went wrong and was reverted)
- Error entries (deployment failed)
- Configuration changes (environment variables or settings modified)
Common Monitoring Scenarios
Monitoring AWS Health Dashboard
AWS publishes service health at https://health.aws.amazon.com/health/status. Monitor this page to catch AWS outages early. Focus on the regions your services run in.
Since AWS's status page is JavaScript-heavy, use a browser-based monitoring tool that renders JavaScript. Simple HTTP-based tools will not see the full page content.
Monitoring GitHub Actions Status
GitHub publishes platform status at https://www.githubstatus.com/. Monitor this to know when Actions is experiencing degradation, which can cause your pipelines to queue or fail.
You can target the specific component section for "Actions" using a CSS selector to avoid alerts about other GitHub services.
Monitoring Docker Hub
Docker Hub outages block container builds. Monitor https://www.dockerstatus.com/ to catch issues before they cascade into failed builds across your team.
Monitoring npm Registry
For JavaScript teams, npm registry outages mean failed installs and broken builds. Monitor https://status.npmjs.org/ to get ahead of these issues.
Reducing Alert Noise
CI/CD monitoring can generate noise if not configured carefully.
Use element-specific monitoring: Instead of monitoring an entire status page, target the specific section for the services you use. This avoids alerts when an unrelated service has an issue.
Set appropriate frequencies: Status pages do not need to be checked every minute. Every 15-30 minutes is sufficient. Build dashboards can be checked more frequently (every 5-10 minutes) during active development hours.
Use AI summaries: Enable AI-generated change summaries so your team immediately understands what changed without having to click through to the status page. A summary like "GitHub Actions moved from Operational to Degraded Performance" is more useful than "page changed."
Filter by severity: If your monitoring tool supports it, set up different notification channels for different severity levels. Informational status updates can go to a low-priority channel, while incidents affecting your core services go to the high-priority channel.
Building a DevOps Status Dashboard
Combine all your CI/CD monitoring into a single view:
- Provider status summary: One row per provider showing current status
- Build pipeline status: Current state of your main pipelines
- Latest deployments: When each environment was last deployed
- Open incidents: Any active incidents from provider status pages
You can build this using your monitoring tool's API, pulling the latest check results for each monitored page and displaying them on an internal dashboard. This gives your team a single place to check infrastructure health.
Choosing your PageCrawl plan
PageCrawl's Free plan lets you monitor 6 pages with 220 checks per month, which is enough to validate the approach on your most critical pages. Most teams graduate to a paid plan once they see the value.
| Plan | Price | Pages | Checks / month | Frequency |
|---|---|---|---|---|
| Free | $0 | 6 | 220 | every 60 min |
| Standard | $8/mo or $80/yr | 100 | 15,000 | every 15 min |
| Enterprise | $30/mo or $300/yr | 500 | 100,000 | every 5 min |
| Ultimate | $99/mo or $999/yr | 1,000 | 100,000 | every 2 min |
Annual billing saves two months across every paid tier. Enterprise and Ultimate scale up to 100x if you need thousands of pages or multi-team access.
Standard at $80/year pays for itself the first time it surfaces a provider incident before your users do, or confirms a deployment went through without anyone manually checking a version endpoint. 100 pages is more than enough to cover the status pages, health endpoints, and release dashboards for a typical engineering team's full infrastructure stack. Checking every 15 minutes instead of relying on manual checks means your team knows about outages and completed deployments within a single quarter-hour. Enterprise at $300/year tightens that to 5-minute checks and expands to 500 pages for larger stacks.
All plans include the PageCrawl MCP Server, so on-call engineers can ask Claude to summarize provider incidents or deployment activity from the monitoring archive rather than digging through alert history by hand. AI assistants can create monitors through conversation on every plan, including Free.
Getting Started
Start monitoring your CI/CD pipeline in three steps:
- List every infrastructure provider and CI/CD platform your team depends on, and find their status pages
- Create a monitor for each status page, with alerts going to your team's Slack or Discord channel
- Add a monitor for your production health or version endpoint to confirm deployments
This basic setup takes about 15 minutes and immediately gives your team visibility into infrastructure issues that would otherwise go unnoticed until they cause problems.