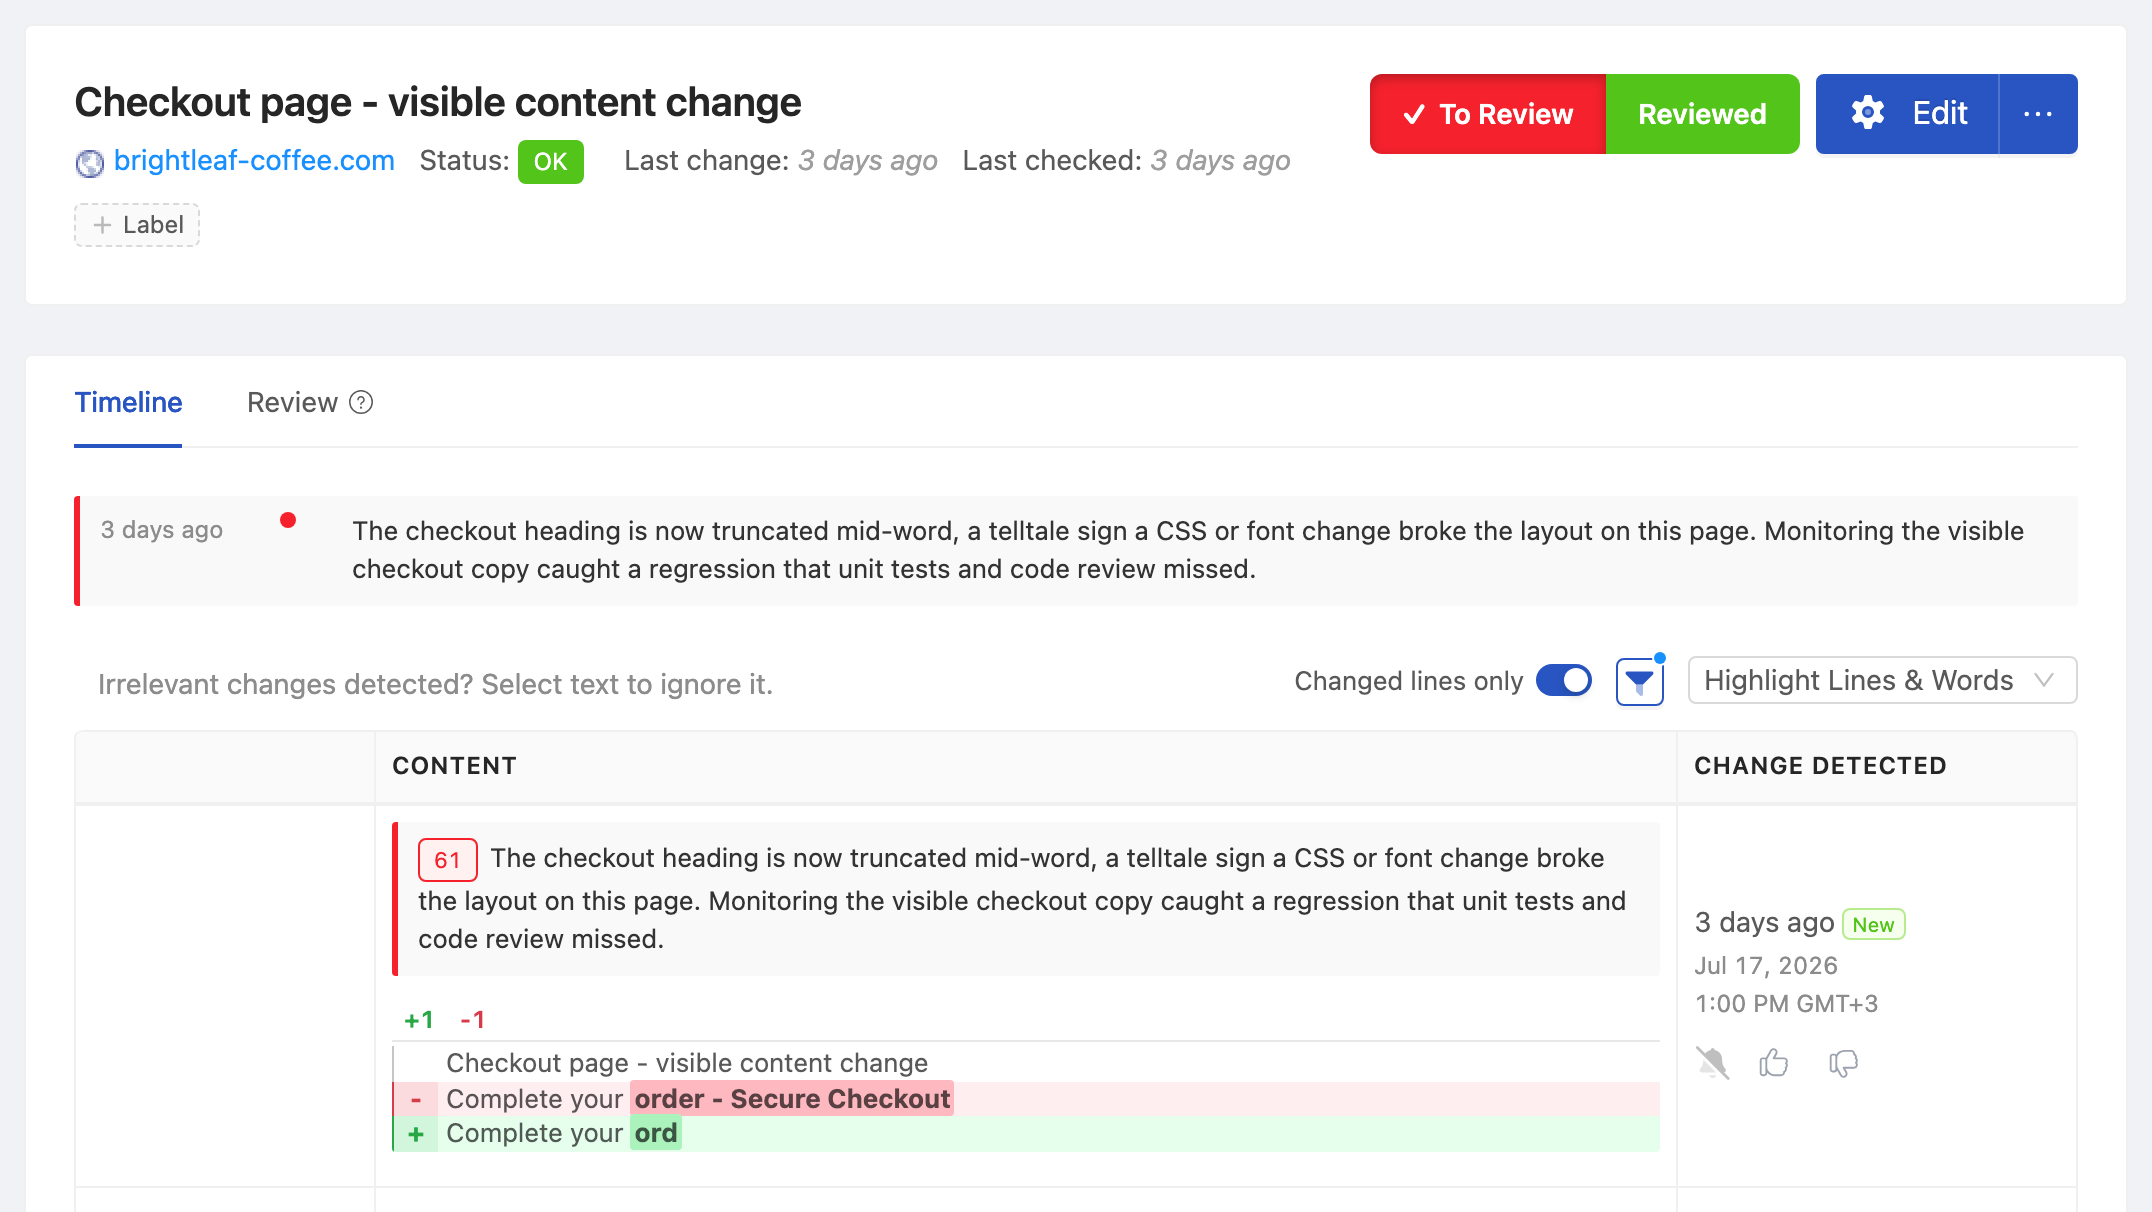
A CSS update breaks your checkout button on mobile. A third-party script shifts your hero section 20 pixels down. A font fails to load, rendering your headline in Times New Roman. These visual regressions are invisible in unit tests and easy to miss in code review. Users notice them immediately.
Visual regression monitoring catches these problems by comparing screenshots of your web pages over time and flagging visual differences. Visual monitoring is one approach within the broader field of website change monitoring. This guide covers what visual regression monitoring is, how it works, when you need it, and the best tools and approaches for different use cases.
What Is Visual Regression Monitoring
Visual regression monitoring compares the visual appearance of a web page at two different points in time. When a difference is detected, it produces a visual diff highlighting exactly what changed.
The concept is simple: take a screenshot, wait, take another screenshot, compare them pixel by pixel. But the implementation involves handling dynamic content, responsive layouts, animation states, and the challenge of distinguishing meaningful changes from noise.
There are two distinct use cases:
Visual regression testing happens during development. You compare screenshots before and after a code change, typically in CI/CD pipelines. The goal is to catch unintended visual side effects of code changes before they reach production.
Visual regression monitoring happens in production. You periodically take screenshots of live pages and compare them against previous versions. The goal is to catch visual problems caused by deployments, third-party script updates, content changes, or infrastructure issues.
This guide focuses on monitoring, but the underlying technology applies to both.
Why Visual Regression Monitoring Matters
Code Changes Have Unintended Side Effects
CSS is global by default. Changing a style in one component can cascade into unexpected changes elsewhere. A developer modifies .card-header for the settings page and accidentally affects every card header across the application. Visual monitoring catches this.
Third-Party Scripts Break Layouts
Ads, analytics, chat widgets, A/B testing tools, and consent banners inject content and styles into your pages. When these third-party scripts update (which happens without your control), they can shift layouts, cover content, or break responsive behavior. You need to know when this happens.
Content Changes Affect Layout
A product title that is 3 words works perfectly. When the content team changes it to 12 words, it overflows the container and breaks the grid. Visual monitoring catches layout issues caused by content changes that no amount of CSS testing would predict.
Cross-Browser and Cross-Device Issues
A page that looks correct in Chrome on desktop might be broken in Safari on mobile. Visual monitoring across different viewports and browsers catches platform-specific regressions.
Performance Degradation Is Visible
When a web font fails to load, images timeout, or a CSS file returns a 404, the visual impact is immediate and obvious in screenshots. Visual monitoring surfaces performance-related visual issues that uptime monitoring would miss entirely, since a server can stay online while the page renders incorrectly.
How Visual Regression Detection Works
Screenshot Capture
The first step is rendering the page in a real browser and capturing a screenshot. This requires a headless browser to ensure JavaScript executes, fonts load, and the page renders as users see it.
Key considerations:
- Viewport size: Capture at specific resolutions (desktop 1920x1080, tablet 768x1024, mobile 375x812)
- Wait conditions: Ensure the page is fully loaded (fonts, images, lazy content)
- Scroll position: Capture the visible viewport or the full page
- Authentication: Log in if the page requires authentication
Pixel-by-Pixel Comparison
The simplest comparison method overlays two screenshots and checks each pixel. If any pixel differs, a change is detected. This method is precise but sensitive to subpixel rendering differences and anti-aliasing.
Perceptual Comparison
More sophisticated tools use perceptual comparison algorithms that account for minor rendering differences. They calculate how visually different two images are to a human eye rather than whether every pixel is identical. This reduces false positives from subpixel rendering, font smoothing, and GPU differences.
Structural Comparison
Some tools compare the DOM structure or layout properties rather than pixels. They detect when elements move, resize, appear, or disappear. This approach is less sensitive to rendering differences but misses purely visual changes like color shifts.
Diff Visualization
When a change is detected, the tool produces a visual diff. Common formats include:
- Side-by-side: Previous and current screenshots next to each other
- Overlay: Differences highlighted in a contrasting color (usually red or magenta)
- Slider: A draggable divider that slides between the two versions
- Diff map: A heatmap showing the magnitude of change at each pixel
Approach 1: Web Monitoring Tools
For production visual monitoring without CI/CD integration, web monitoring tools are the simplest approach.
How PageCrawl Handles Visual Monitoring
PageCrawl captures screenshots on every check automatically. When a visual change occurs:
- Full-page screenshots: Every check renders the page in a full browser and captures a screenshot
- Visual comparison: Screenshots are compared against the previous version
- Change detection: Visual differences are flagged alongside text content changes
- AI analysis: The AI summarizes visual changes (e.g., "New banner added to the top of the page")
- Notifications: Alerts via email, Slack, Discord, or webhook with the screenshot attached
Setting up visual monitoring in PageCrawl:
- Create a monitor for the URL you want to track visually
- Enable screenshots (enabled by default)
- Set the check frequency based on how often the page might change
- Configure notifications for change alerts
- Use element tracking if you want to focus on a specific section of the page
Advantages:
- No CI/CD integration required
- Works on any public (or authenticated) website
- Built-in notification system
- AI-powered change summaries
- Historical screenshot archive
- Anti-bot handling for difficult sites
Best for:
- Monitoring production websites for visual regressions after deployments
- Tracking visual changes on competitor websites
- Monitoring third-party content for layout breakage
- Visual archiving and compliance (screenshot evidence of page states)
Approach 2: CI/CD Visual Regression Testing
For catching visual regressions before they reach production, integrate visual testing into your CI/CD pipeline.
Popular CI/CD Visual Testing Tools
Percy (BrowserStack)
Percy integrates with your test suite. During tests, you capture screenshots with percySnapshot(). Percy compares them against approved baselines and flags visual diffs in your pull request.
// Cypress + Percy
describe('Homepage', () => {
  it('renders correctly', () => {
    cy.visit('/');
    cy.percySnapshot('Homepage');
  });

  it('renders correctly on mobile', () => {
    cy.viewport('iphone-x');
    cy.visit('/');
    cy.percySnapshot('Homepage - Mobile');
  });
});
Chromatic (Storybook)
Chromatic captures screenshots of every Storybook story on each commit. It detects visual changes in individual components, making it easy to pinpoint which component changed.
BackstopJS (Open Source)
BackstopJS runs locally or in CI. You define reference screenshots and test screenshots, and it produces a visual diff report.
{
  "viewports": [
    { "label": "desktop", "width": 1920, "height": 1080 },
    { "label": "mobile", "width": 375, "height": 812 }
  ],
  "scenarios": [
    {
      "label": "Homepage",
      "url": "http://localhost:3000",
      "delay": 2000
    },
    {
      "label": "Pricing Page",
      "url": "http://localhost:3000/pricing",
      "selectors": [".pricing-table"]
    }
  ]
}
Playwright Visual Comparisons
Playwright has built-in visual comparison support:
const { test, expect } = require('@playwright/test');

test('homepage visual regression', async ({ page }) => {
  await page.goto('/');
  await expect(page).toHaveScreenshot('homepage.png', {
    maxDiffPixelRatio: 0.01
  });
});
Approach 3: Hybrid (CI/CD + Production Monitoring)
The most robust setup combines both approaches:
- CI/CD visual testing catches regressions before deployment (Percy, Chromatic, or Playwright)
- Production visual monitoring catches issues that slip through or are caused by factors outside your code (PageCrawl)
This covers:
- Code-induced visual regressions (caught in CI/CD)
- Third-party script changes (caught in production monitoring)
- Content-induced layout issues (caught in production monitoring)
- Infrastructure failures (caught in production monitoring)
Comparison: Visual Monitoring Approaches
| Feature | Web Monitoring (PageCrawl) | CI/CD Tools (Percy, Chromatic) | Open Source (BackstopJS, Playwright) |
|---|---|---|---|
| Setup complexity | Low (minutes) | Medium (hours) | Medium-High (hours) |
| CI/CD integration | Not needed | Required | Required |
| Production monitoring | Yes | No (pre-deployment only) | Not designed for it |
| Notification system | Built-in (email, Slack, webhook) | PR comments, Slack | Manual setup |
| Anti-bot handling | Built-in | N/A (tests your own site) | N/A |
| Historical archive | Yes (full change history) | Yes (per-build snapshots) | Manual |
| AI change summaries | Yes | No | No |
| Cost | Per-monitor pricing | Per-snapshot pricing | Free (self-hosted) |
| Best for | Production visual monitoring | Pre-deployment testing | Budget-conscious teams |
Handling Common Challenges
Dynamic Content
Pages with dynamic content (timestamps, live feeds, ads, randomized elements) produce false positives. Strategies:
- Element masking: Exclude specific areas from comparison (e.g., mask the ad container, timestamp, or live counter)
- Element-specific monitoring: Instead of full-page screenshots, target specific page sections with CSS selectors
- Threshold tuning: Set a minimum pixel difference threshold to ignore minor changes
Animation States
Animated elements will look different on every screenshot depending on when the capture happens. Solutions:
- Disable animations: Inject CSS to disable transitions and animations before capture
- Wait for idle: Wait until animations complete before capturing
- Capture specific frames: Use scroll-to and click actions to reach a stable state
/* Injected CSS to disable animations */
*, *::before, *::after {
  animation-duration: 0s !important;
  transition-duration: 0s !important;
}
Responsive Breakpoints
A visual regression might only occur at specific viewport widths. Monitor at your key breakpoints:
- Desktop: 1920px, 1440px, 1280px
- Tablet: 768px, 1024px
- Mobile: 375px, 414px
PageCrawl's viewport settings let you specify the exact width for each monitor, so you can create separate monitors for each breakpoint on critical pages.
Font Loading Failures
Web fonts that fail to load cause dramatic visual changes (fallback fonts have different metrics). This is a legitimate visual regression, and monitoring should catch it. Ensure your screenshot capture waits for font loading to complete before capturing.
Subpixel Rendering Differences
Different machines, GPUs, and operating systems render fonts and shapes slightly differently at the subpixel level. This is noise, not a regression. Use perceptual comparison or set a small pixel difference threshold (0.1-1%) to filter this out.
Real-World Use Cases
E-Commerce: Protecting the Checkout Flow
An online retailer monitors their checkout flow (cart, shipping, payment, confirmation pages) at 3 responsive breakpoints:
- What they catch: Broken layouts from CSS updates, missing payment icons, shifted CTA buttons, overlapping elements on mobile
- Frequency: Every 2 hours during business hours
- Alert channel: Slack #frontend-alerts
- Impact: Caught a checkout button that was hidden below the fold on iPhone SE after a third-party payment SDK update. Fixed within 1 hour instead of days.
SaaS: Monitoring the Marketing Site
A SaaS company monitors their marketing site (homepage, pricing, features, blog) for visual regressions:
- What they catch: Layout breakage from CMS content changes, broken images, missing sections after deployments
- Frequency: Every 6 hours
- Alert channel: Email to the marketing team
- Impact: Detected that a pricing page redesign accidentally removed the enterprise tier card. Fixed before any enterprise leads saw the incomplete page.
QA Team: Cross-Browser Validation
A QA team uses visual monitoring to validate their web application across different environments:
- What they check: The same 20 critical pages at desktop and mobile viewports
- Frequency: After each deployment (triggered via webhook)
- Alert channel: Jira ticket auto-creation
- Impact: Identified a Safari-specific rendering bug where a flex container collapsed on iOS. The bug had been in production for 2 weeks before monitoring was set up.
Best Practices
Start with Critical Pages
Do not monitor every page on your site. Start with pages that directly affect revenue or user experience:
- Homepage and landing pages
- Pricing page
- Checkout/payment flow
- Login/signup forms
- Dashboard (for SaaS)
- Product pages (for e-commerce)
Use Meaningful Baselines
Your baseline (the "known good" state) should represent how the page is supposed to look. Review and approve baselines carefully. A broken baseline means every future comparison is measured against a broken state.
Set Appropriate Thresholds
Zero-tolerance pixel comparison generates too many false positives. Start with a 0.5-1% pixel difference threshold and adjust based on your false positive rate. Pages with more dynamic content need higher thresholds.
Monitor at Multiple Viewports
A page that looks perfect on desktop might be broken on mobile. At minimum, monitor at one desktop width (1440px or 1920px) and one mobile width (375px).
Combine Visual and Text Monitoring
Visual monitoring catches layout issues. Text monitoring catches content changes. The most comprehensive approach uses both. PageCrawl tracks both text content and screenshots simultaneously, so a single monitor covers both visual and textual changes.
Respond Quickly to Alerts
Visual regression monitoring is only valuable if you act on the alerts. Integrate alerts into your team's workflow (Slack, PagerDuty, Jira) and establish response protocols. A visual regression on the checkout page should be treated with the same urgency as a server error.
Choosing your PageCrawl plan
PageCrawl's Free plan lets you monitor 6 pages with 220 checks per month, which is enough to validate the approach on your most critical pages. Most teams graduate to a paid plan once they see the value.
| Plan | Price | Pages | Checks / month | Frequency |
|---|---|---|---|---|
| Free | $0 | 6 | 220 | every 60 min |
| Standard | $8/mo or $80/yr | 100 | 15,000 | every 15 min |
| Enterprise | $30/mo or $300/yr | 500 | 100,000 | every 5 min |
| Ultimate | $99/mo or $999/yr | 1,000 | 100,000 | every 2 min |
Annual billing saves two months across every paid tier. Enterprise and Ultimate scale up to 100x if you need thousands of pages or multi-team access.
Standard at $80/year pays for itself the first time it catches a broken checkout button or a shifted CTA on a revenue-critical page before real users encounter it. 100 monitored pages covers your entire critical path at multiple viewports, with room to add competitor pages alongside your own. Enterprise at $300/year scales to 500 pages at 5-minute checks with SSO and multi-team access.
All plans include the PageCrawl MCP Server, which connects your screenshot and change history directly to Claude and Cursor. Teams can ask "did the pricing page layout change after last Tuesday's deploy?" and get a visual answer pulled from their own monitoring archive, which turns routine screenshot captures into a queryable record of your site's visual history. AI assistants can create monitors through conversation on every plan, including Free.
Getting Started
Start with one critical page. Set up a PageCrawl monitor with screenshots enabled (enabled by default). Check every 2-6 hours. When a visual change is detected, review the screenshot comparison to understand what changed.
If you also want pre-deployment visual testing, add Playwright visual comparisons to your CI/CD pipeline. This gives you coverage at both stages: before deployment and after.
PageCrawl's free tier includes 6 monitors with screenshot capture, enough to monitor your most critical pages and prove the value before expanding.